KANOMAX 3910 Portable Particle Counter User Manual User Manual
Page 20
3. Display Description and Operation Procedure
12
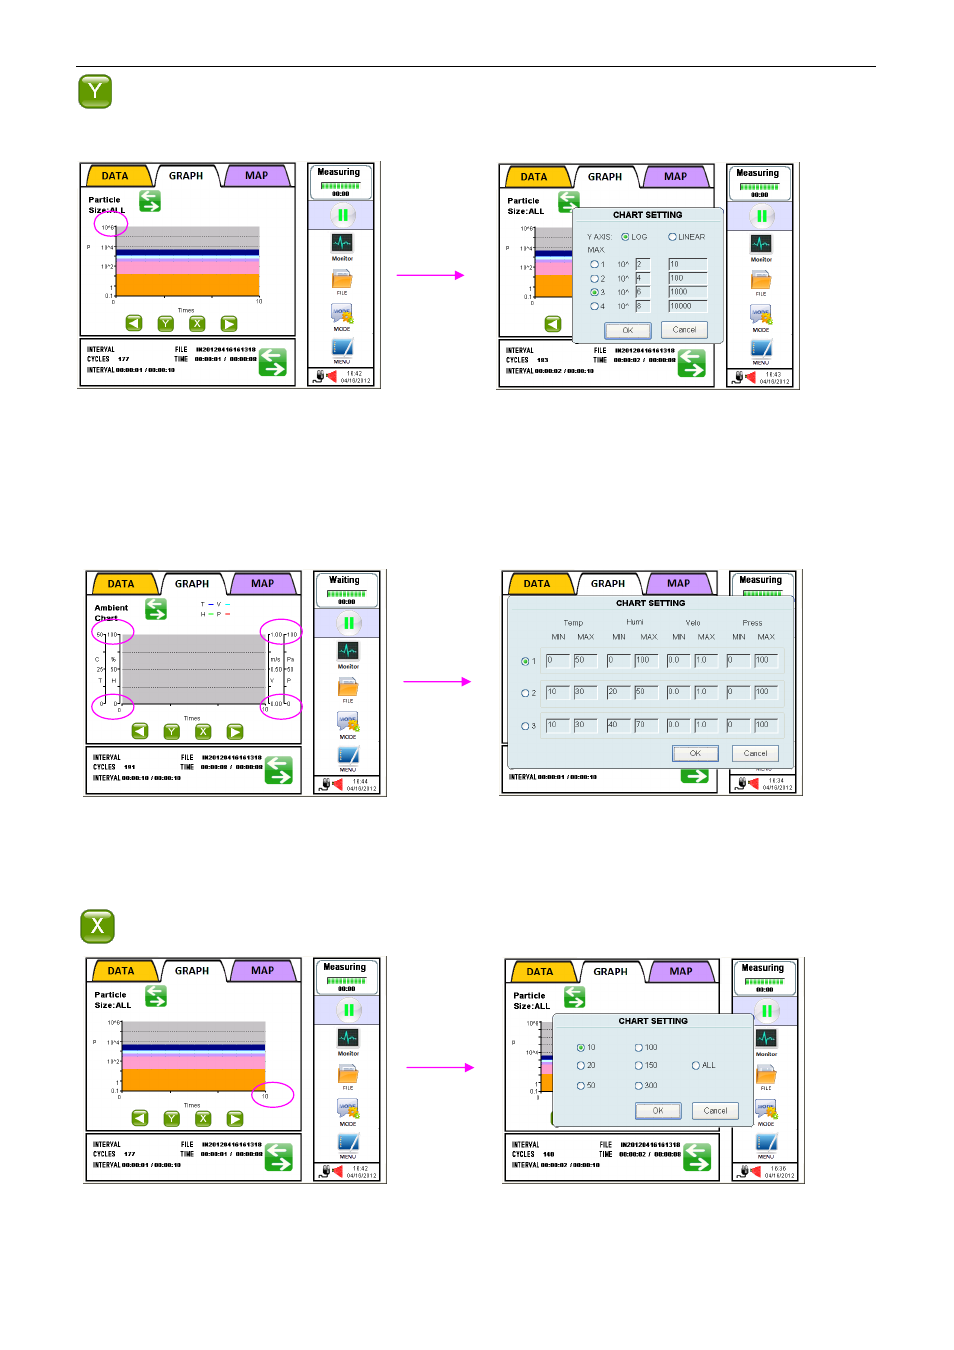
:Sets the range of the Y axis.
Particle Graph (Example)
:
Select either LOG or LINEAR for the Y axis. Select the maximum scale value from four options.
For setting the four maximum values, please refer to 3.8.1 MEASURING – CHART SETTING.
In the display shown above, LOG is selected for the scale of the Y axis and the maximum scale
value of the Y axis is set to 10 to the sixth.
Option Sensor Graph (Example)
:
Select one of the three combinations of minimum and maximum scale values of the Y axis for
each sensor. For setting the combination of minimum and maximum values, please refer to
3.8.1 MEASURING – CHART SETTING.
: Sets the range of the X axis.