Displays, Viewing several loops: bar graph display – Watlow MLS User Manual
Page 63
Using the MLS
MLS User’s Guide 51
Displays
This section describes the MLS' displays.
Viewing Several Loops: Bar Graph Display
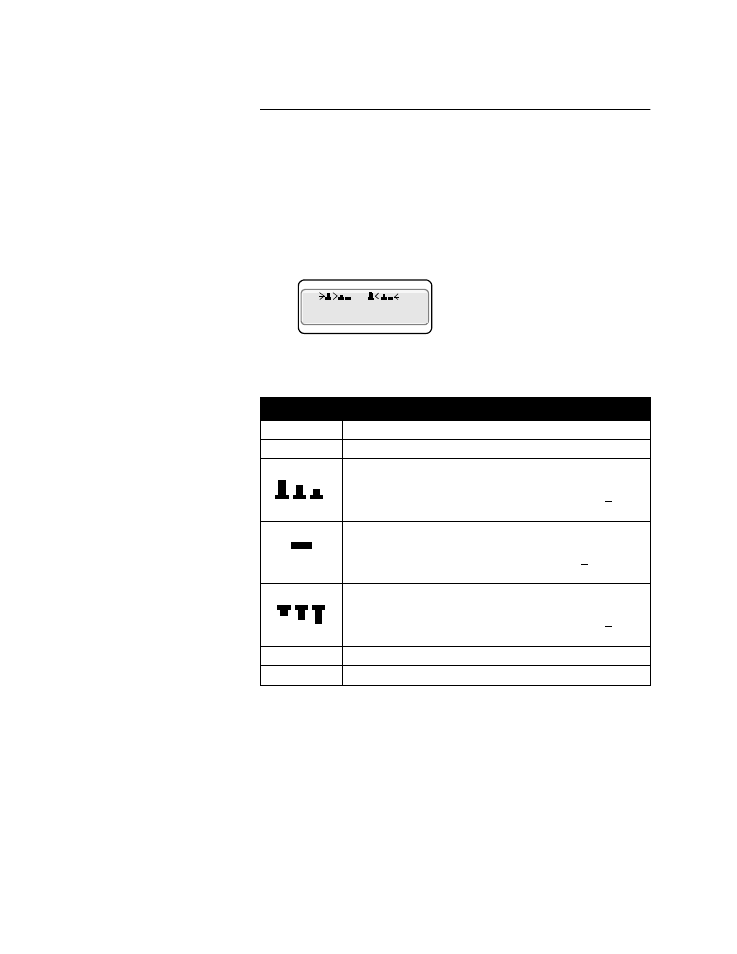
When you connect power to the MLS, it displays general symbolic
information for loops 1-8. This display is called Bar Graph mode. The
next figure shows a picture of the Bar Graph display.
This table explains the symbols on the top line of the Bar Graph display.
The next table explains the symbols you see on the bottom line of the
Bar Graph display and in the Single Loop display. These symbols
appear when the controller is in both dual output mode and single output
mode. If the process goes into alarm, the controller automatically
switches to Single Loop display and shows an alarm code.
Symbol
Symbol’s Meaning
<
Loop is in low process or low deviation alarm.
>
Loop is in high process or high deviation alarm.
Loop is above setpoint. If you enable the high or low devia-
tion alarm, this symbol is scaled to it. If you don’t enable
these alarms, these symbols are scaled to the setpoint +5% of
the sensor’s range.
Loop is at setpoint. If you enable the high or low deviation
alarm, this symbol is scaled to it. If you don’t enable these
alarms, these symbols are scaled to the setpoint +5% of the
sensor’s range.
Loop is below setpoint. If you enable the high or low devia-
tion alarm, this symbol is scaled to it. If you don’t enable
these alarms, these symbols are scaled to the setpoint +5% of
the sensor’s range.
(Blank)
Loop is set to SKIP.
F
Sensor has failed.
LOOP PROCESS UNITS
ALARM SETPOINT STATUS OUT%
01 08
AAAA MAMA