Spreadsheet view, Errors vs. time, Spreadsheet view errors vs. time – Teledyne LeCroy PeRT3 Eagle Systems User Manual
Page 60
Version 1.6
PeRT
3
Eagle User Manual
56
LeCroy Corporation
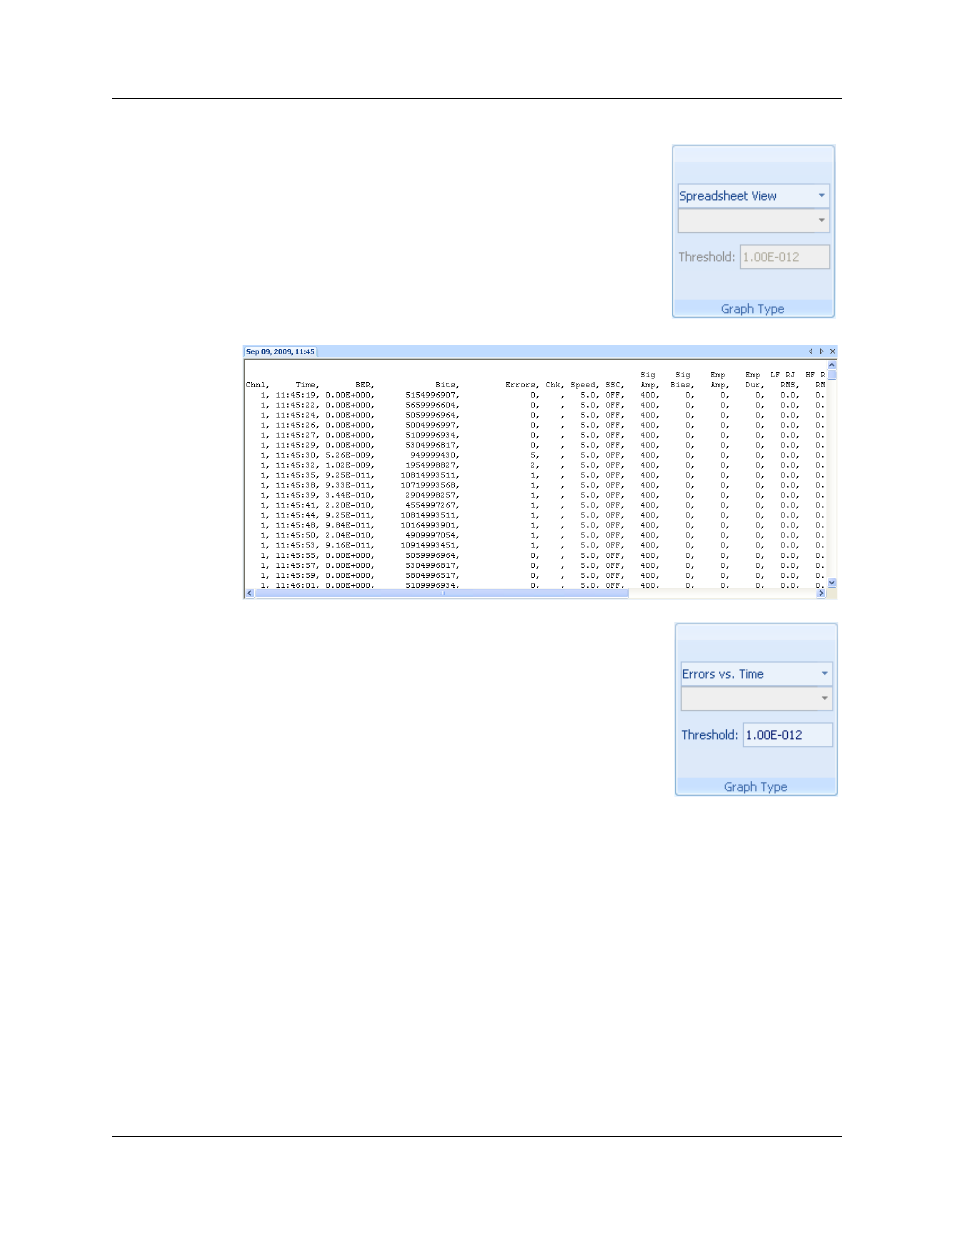
Spreadsheet
View
This creates a text listing, in comma-delimited format, of test
settings and results for each test case. In this selection, the
remaining fields in the Graph Type panel are not used.
The spreadsheet view can be exported as a CSV file suitable
for import into Microsoft Excel or any program which import
comma delimited files. To export the spreadsheet view, select
Export current document from the Export option under the
main file menu (accessible from the round Eagle button in the
upper left corner of the application.
Errors vs.
Time
With this selection, a chronological graph shows the errors and
BER. Error and BER data is recorded and graphed at the end
of each test case, or once per minute during test cases that last
more than one minute There is a horizontal line indicating the
BER threshold; the vertical position of this line can be changed
by entering a new value into the Threshold field. Channels can
be added to or removed from the graph by clicking on the
channel number(s) in the Data Set panel. When first
displayed, the Errors vs Time graph defaults to showing all
available channels. When switching between graphs, the new
view will show just the channel(s) that were being displayed in the previous graph.