Analysis graph types, Log view – Teledyne LeCroy PeRT3 Eagle Systems User Manual
Page 59
PeRT
3
Eagle User Manual
Version 1.6
LeCroy Corporation
55
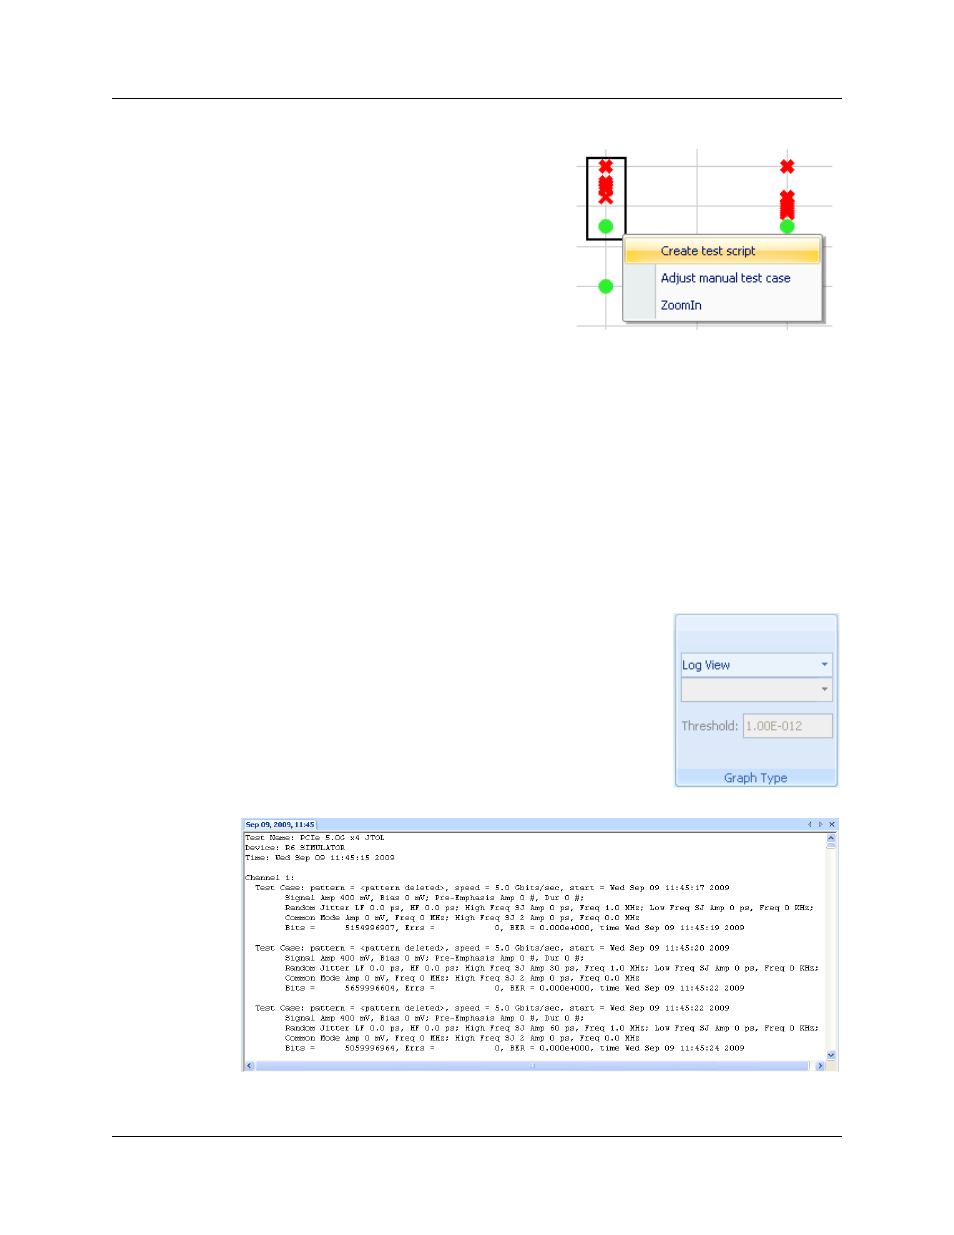
When a region of the graph is selected using
the Region Select tool, the user is given the
options of creating a new test script to test just
the region selected, to adjust a manual test
case to cover just the region selected, or to
zoom in to that specific area of the chart.
Analysis Graph Types
Within the Graph Type panel of the Analysis tab, there are multiple choices of ways to
view your data. Each of these will be demonstrated using a sample test, which in this
case is a typical jitter tolerance test for a receiver system, for PCI Express over four
channels. This test script is called "PCIe 5.0G x4 JTOL". This script determines the
performance envelope of a receiver system by testing BER with added signal
impairments of high frequency sinusoidal jitter of 1 to 100 MHz at signal amplitudes from
0 to 180 ps. This creates a matrix of individual test cases that collectively describe the
performance envelope of the receiver system.
The choices for displaying the data are as follows:
Log View
This creates a text listing of each specific test case, including
the system settings for that test case and the results obtained.
In this selection, the remaining fields in the Graph Type panel
are not used.