Chapter 9: analysis and reports, System control ribbon -- analysis tab, Chapter 9 – Teledyne LeCroy PeRT3 Eagle Systems User Manual
Page 57: Analysis and reports
PeRT
3
Eagle User Manual
Version 1.6
LeCroy Corporation
53
Chapter 9: Analysis and Reports
A wide variety of different graphs and reports are available to help the user analyze data
collected by the PeRT
3
Eagle Test System. These graphs and reports are selectable
under the Analysis tab in the System Control Ribbon.
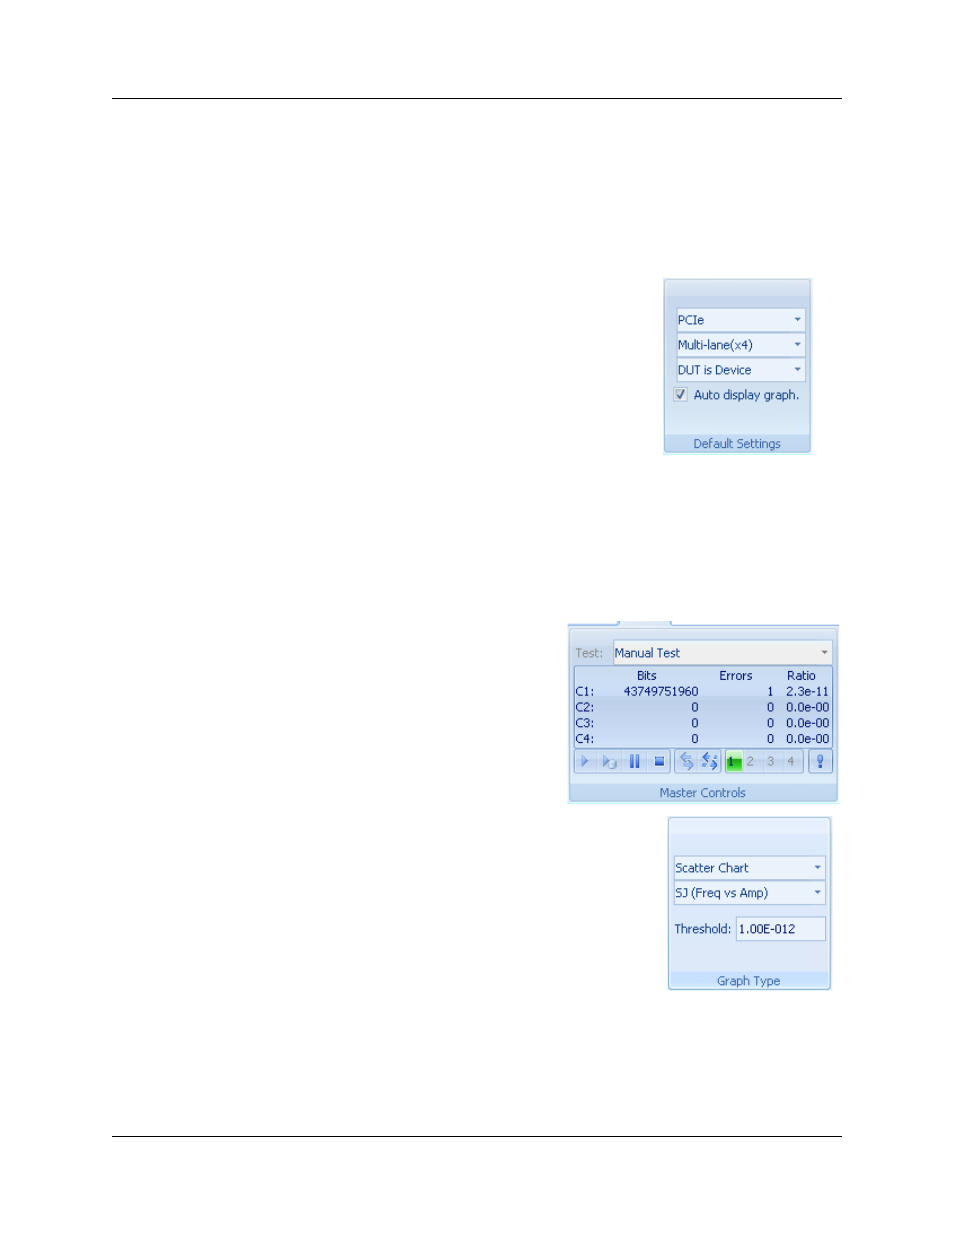
Note: During the actual running of a test, the test
can be monitored in a variety of ways. A
useful way to monitor the results while a
test is running is to check the Auto display
graph box in the Default Settings panel
under the Options tab. This will display the
test results as they are being collected, and
allows the user to view the results in
different formats. Once the test is started,
the user can select a different display graph
format by clicking on the Analysis tab and
selecting a different display in the Graph Type panel.
System Control Ribbon -- Analysis Tab
The Analysis tab of the System Control Ribbon contains five panels to display test status
and to allow the user to examine test data in a variety of ways.
Master Controls
The Master Controls panel under the
Analysis tab contains the same indicators
and controls that are located in the Master
Controls panel under the Main tab.
Graph Type
The Graph Type panel allows the user to select from a range
of charts and reports. These are described in more detail in
the following section.