Vector signal analysis graticule displays -30 – Anritsu Series MS278XB User Manual
Page 82
Graphical User Interface Overview
Instrument Overview
3-30
MS278XB OM
Vector Signal Analysis Graticule Displays
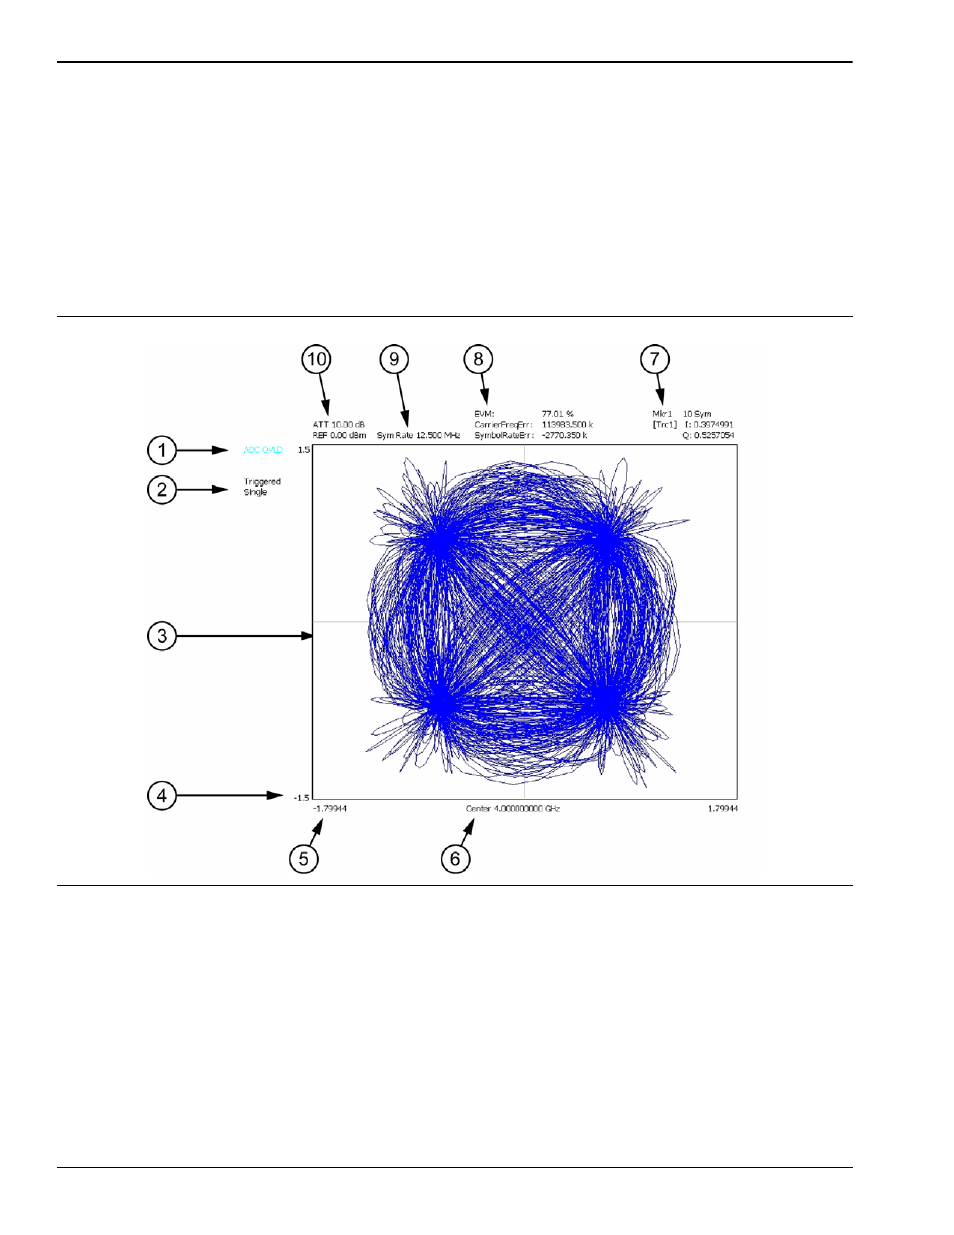
Figure 3-28 shows trace data while using the various modulation graph types indicated below:
• Vector Graph Type
• EVM/Time Graph Type
• Constellation Graph Type
• Power/Time Graph Type
• Eye(I) Graph Type
• Eye(Q) Graph Type
Figure 3-28. Vector Signal Analysis Graticule