IronPort Systems 4108GL User Manual
Page 74

4-18
Using the HP Web Browser Interface
Status Reporting Features
U
si
n
g t
h
e HP Web
Br
owser
In
te
rf
a
c
e
■
Maximum Activity Indicator:
As the bars in the graph area change
height to reflect the level of network activity on the corresponding port,
they leave an outline to identify the maximum activity level that has been
observed on the port.
Utilization Guideline.
A network utilization of 40% is considered the
maximum that a typical Ethernet-type network can experience before encoun-
tering performance difficulties. If you observe utilization that is consistently
higher than 40% on any port, click on the Port Counters button to get a detailed
set of counters for the port.
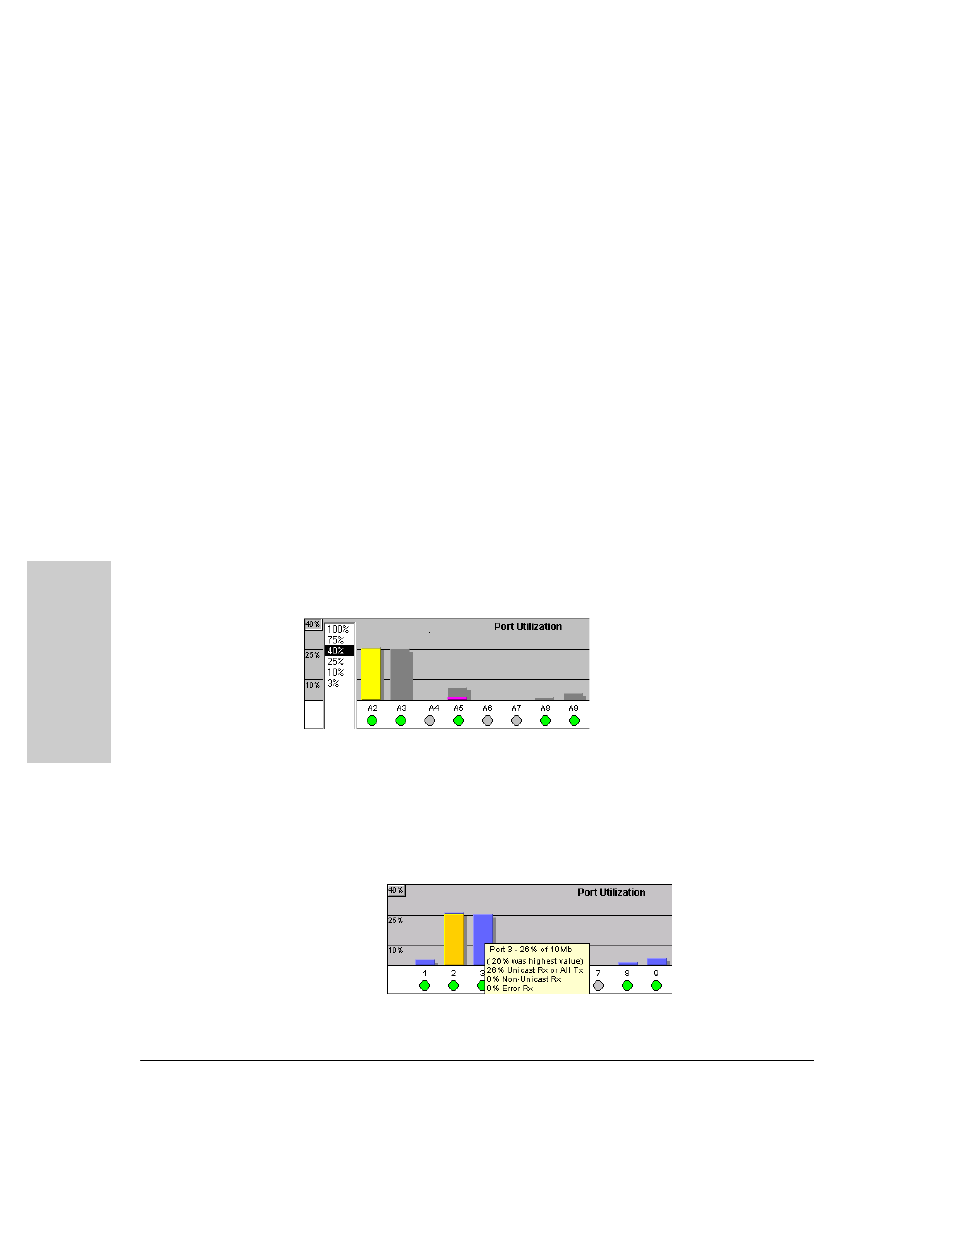
To change the amount of bandwidth the Port Utilization bar graph
shows.
Click on the bandwidth display control button in the upper left corner
of the graph. (The button shows the current scale setting, such as 40%.) In the
resulting menu, select the bandwidth scale you want the graph to show (3%,
10%, 25%, 40%, 75%, or 100%), as shown in figure figure 4-10.
Note that when viewing activity on a gigabit port, you may want to select a
lower value (such as 3% or 10%). This is because the bandwidth utilization of
current network applications on gigabit links is typically minimal, and may
not appear on the graph if the scale is set to show high bandwidth utilization.
Figure 4-10. Changing the Graph Area Scale
To display values for each graph bar.
Hold the mouse cursor over any of
the bars in the graph, and a pop-up display is activated showing the port
identification and numerical values for each of the sections of the bar, as
shown in figure 4-11 (next).
Figure 4-11. Display of Numerical Values for the Bar
