KACO Powador XP500-XP550-HV TL outdoor User Manual
Page 83

Page 84
Operating Instructions Powador XP500/550-OD-TL
P a r a m e t e r s
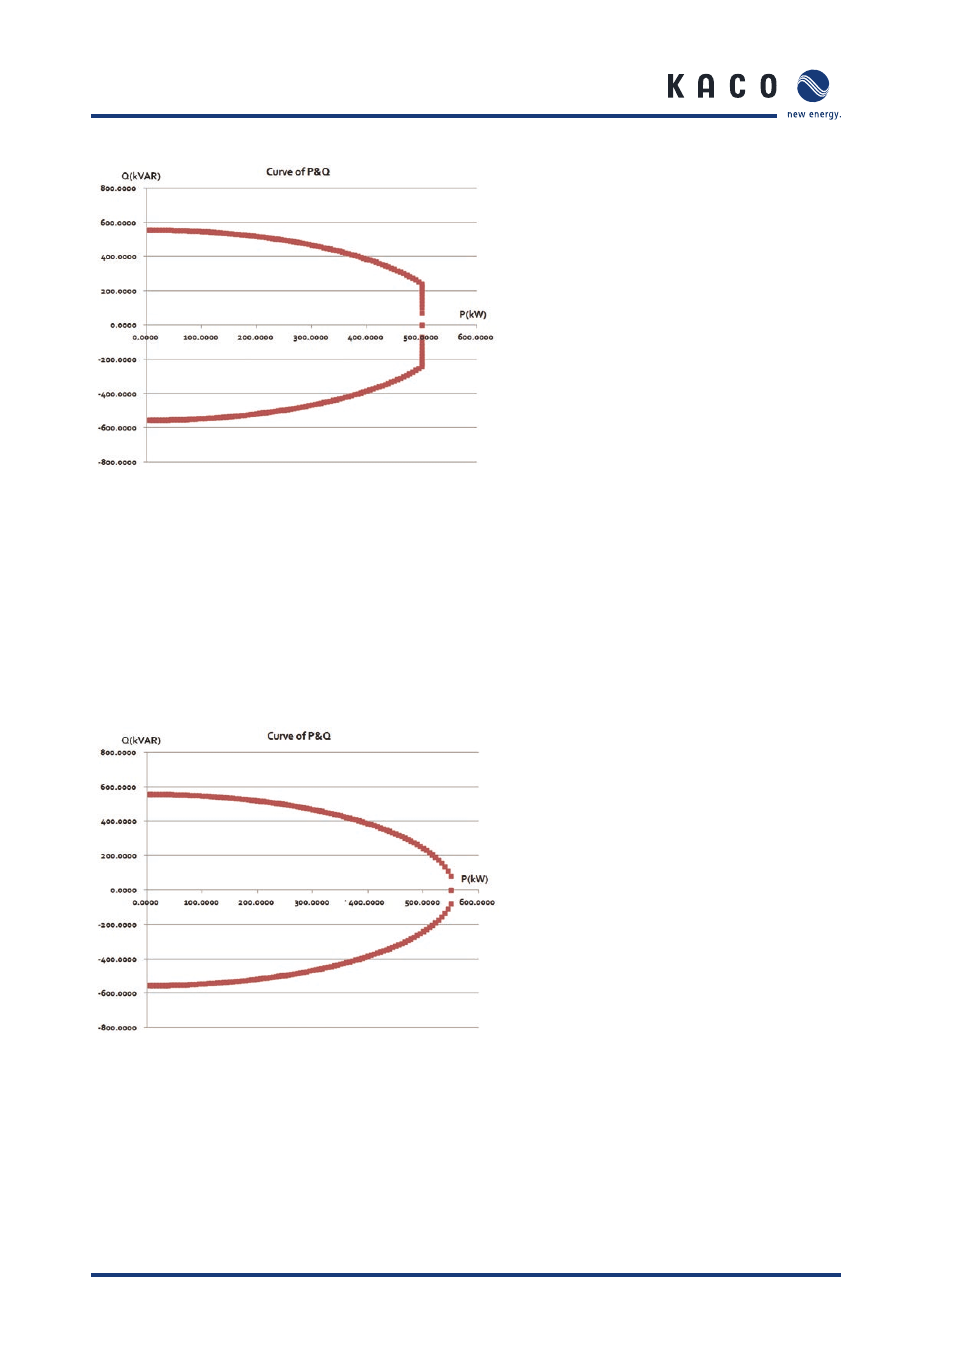
Figure 56: PQ Diagram of XP500-OD-TL
Output power limit is based on apparent power which is 111% of the rated power. In other words, where the
apparent power is over the rated power, active/reactive power is reduced at same rate respectively so that the
fi nal output power does not exceed 111% of the rted power.
PQ diagram above shows that the reactive power is from 0 to 242kVAR according to the power factor which is
from 1 to 0.9, the active power is up to 500kW and active/reactive power is not limited because the fi nal output
apparent power is not over 555kVA (111% of the rated power). And because the apparent power is over
555kVA where power factor is less than 0.9 the active/reactive power is reduced.
Figure 57: PQ Diagram of XP550-OD-TL
Output power limit is based on apparent power which is 101% of the rated power. In other words, where the
apparent power is over the rated power caused by reducing power factor, active/reactive power is reduced at
same rate respectively so that the fi nal output power does not exceed 101% of the rated power.
When changing the power factor from 1 to 0.9, the active power is down to 500kW and the reactive power
will be up from 0 to 242kVAR since the fi nal output apparent power should be remained at 555kVA (101% of
rated power). In case of power factor is 1.0, the output power is 550kW (550kVA).
