Measurement Computing eZ-TOMAS version 7.1.x User Manual
Page 87
eZ-TOMAS & eZ-TOMAS Remote
927692
Display Menu …. Reports & Logs 8-3
Using a Statistical Report to Generate Limits
Statistical reports can be used to automatically generate limit values based on history data. If you have
acquired and stored data at a steady state machine condition Tomas can calculate limits for you based on
the Average and Variance of the data.
1. On the Display pull-down menu select Statistical; the History Data window will open.
2. Drag the top slide pointer across the time scale to select the Start Date and Time for the report.
3. Drag the lower slide pointer across the time scale to select the End Date and Time for the report.
4. Click the <OK> button. The Statistical Report will be displayed.
5. Open the File menu (in the Statistical Reports window).
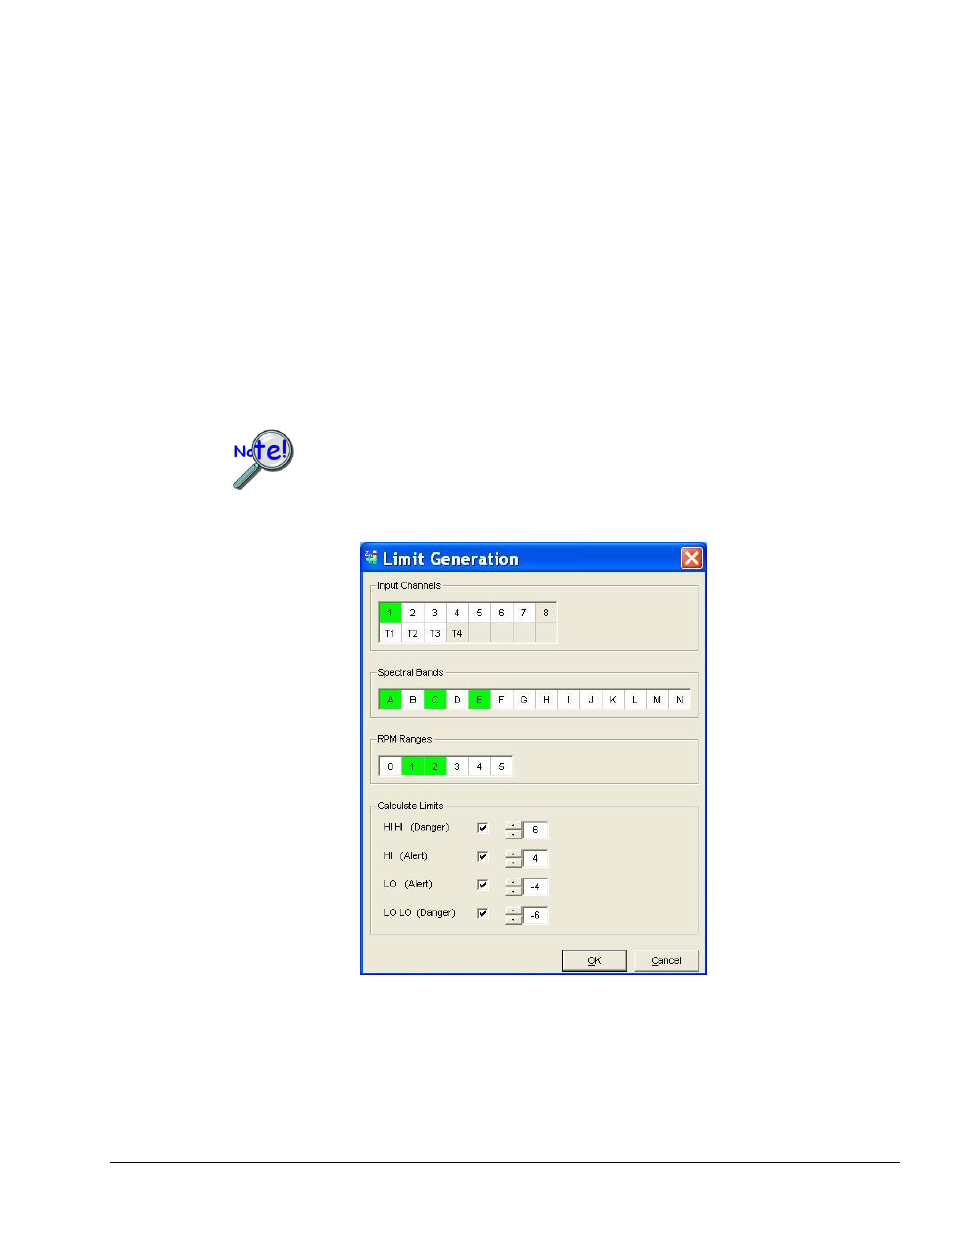
6. Select “Generate Limits.” The Limit Generation dialog box will appear (see following figure).
7. Use the checkboxes, as applicable, to select: (a) the Input Channels for which you want Limit
Calculations performed, (b) the Spectral Bands for which limits should be generated, (c) the
RPM Ranges, if applicable, (d) the Standard Deviation to be used for HI HI (Danger), HI
(Alert), LO (Alert), and LO LO (Danger). (See following figure).
Limit values are not used if:
(a) the „HiHi limit value‟ minus the „LoLo limit value‟ is less than 5% of the
instrument scale, or
(b) the limit value is outside of the instrument range.
Limit Generation
8. Click the
9. Click <Yes>.