7 - plot examples, Plot examples 7 – Measurement Computing eZ-TOMAS version 7.1.x User Manual
Page 62
eZ-TOMAS & eZ-TOMAS Remote
887491
Display Menu … Plots Plot Examples 7-1
Plot Examples
7
This chapter provides examples of the various plot types. The following chapters are directly related to this
one and may need reviewed or referred to.
Chapter 5, Display Menu… Plot Windows, discusses:
o
how to save and recall plot setups
o
change display ranges
o
change scales
o
Real Time and History Data (playback) modes
o
channels
o
filtering data
Chapter 6, Toolbar Buttons, identifies the layout of the
toolbars and explains the purpose of each button.
Selecting Plots from the Display pull-down menu opens a Data Display window. Note that you can
double-click on a gauge to open a Data Display window for plotting the data for that gauge.
For real-time displays, you can halt and resume the display of data by using the Pause/Continue toggle
button, or use the “P” key on the keyboard. When viewing historical data, you can use the playback buttons
and the history data slider to navigate through the data.
You can view either real-time data or historical data. In the examples that follow we are viewing historical
data, thus the History button has been clicked, and appears “active” [green] on our screen.
Prior to viewing a plot you need to:
• select the channels to be displayed
• select the desired data display format, e.g., Time Display, Spectrum, or Waterfall
• select the data source, i.e., a “Real Time” source, or a history data file
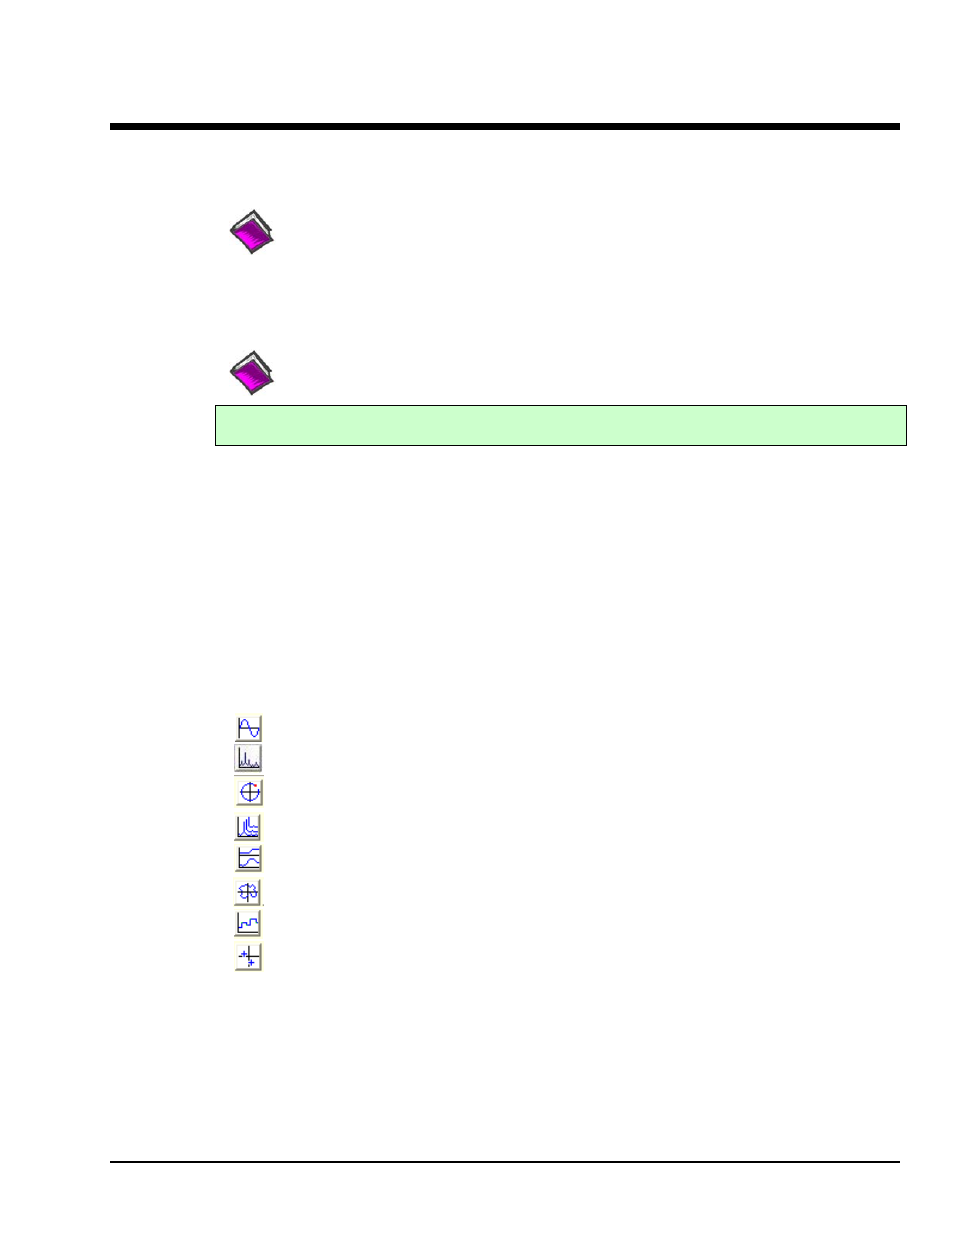
The examples in this chapter consist of the following:
Time Waveforms …… 7-1
Spectrum …… 7-6
Orbit …… 7-8
Waterfall …… 7-12
Bode …… 7-14
Polar …… 7-16
Strip Chart …… 7-19*
Shaft Centerline …… 7-22
*Note for IOtech 655 Users: Use the Strip Chart for meaningful temperature plots.