6 - toolbar buttons, Toolbar buttons 6, Toolbar – Measurement Computing eZ-TOMAS version 7.1.x User Manual
Page 59
eZ-TOMAS & eZ-TOMAS Remote
938592
Toolbar Buttons 6-1
Toolbar Buttons
6
1
st
Toolbar
1
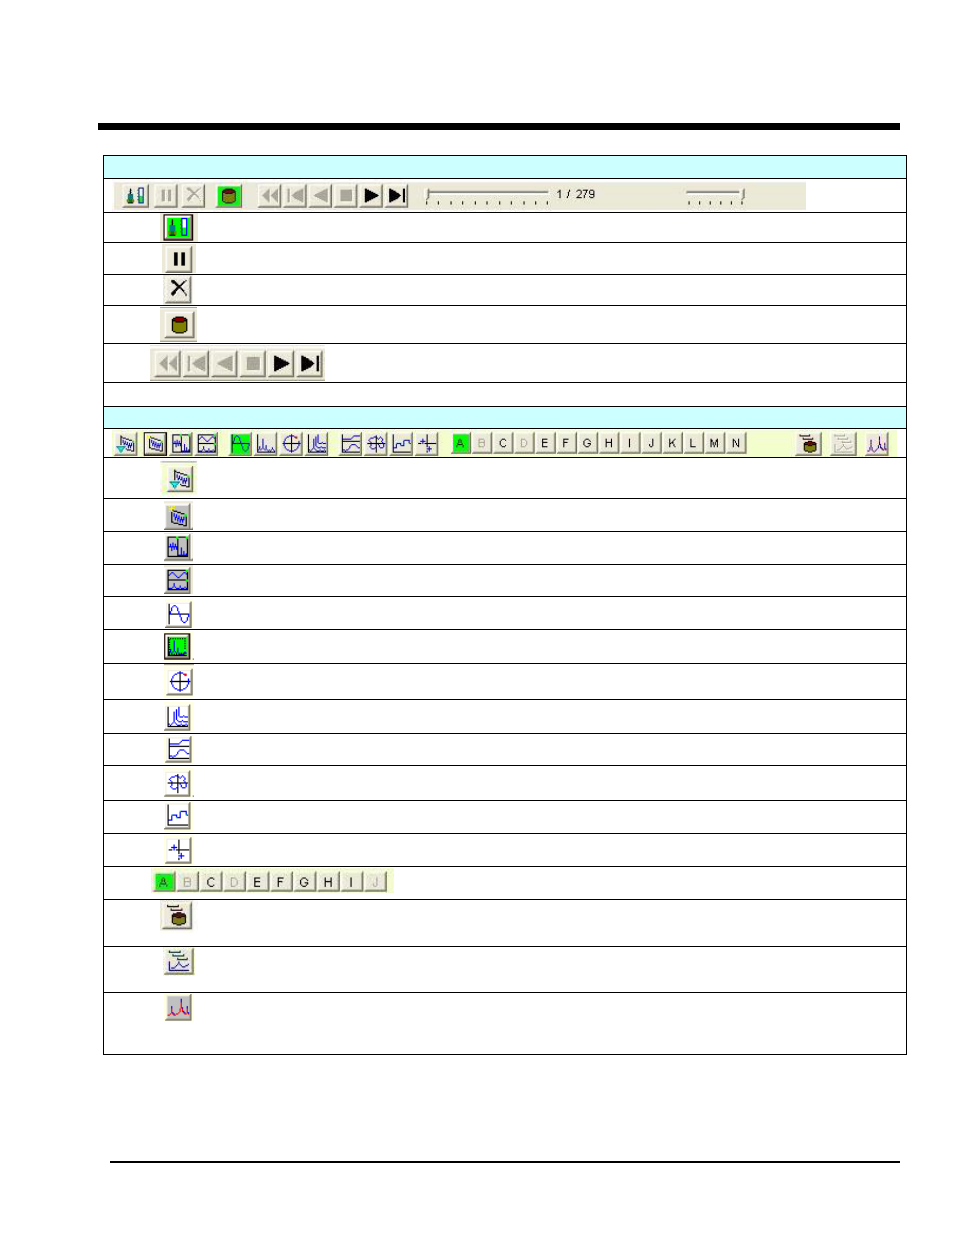
Data Source-Real Time – selects the “Real Time” live data acquisition mode or the “History Data” (Play Back) mode.
2
Pause / Continue – toggles to pause or continue data monitoring. Applies only to the Real Time mode.
3
Clear Real Time Plot Buffer allows you to clear the data in the realtime trend displays. This display option can be used
to clear the plot displays prior to starting a test.
4
Data Source-History File – Opens the History Data Dialog Box to select a file for viewing via the playback (history data)
mode. After clicking this button the playback buttons and related slider will appear.
5
Playback Buttons – From left to right, the buttons are:
Rewind, Step Backward One Record, Stop, Play, and Step Forward One Record.
2
nd
Toolbar
1
Select Plot Setup File – Pops-up a list of saved plot setup files (.tps) which you can select to display.
2
Open New Plot Window – Adds one more plot window to the screen. Note that there is a limit of 8 plot windows.
3
Align Plots, Vertical Orientation – Affective with 2 or more plots. This function orients the plot windows such that they
are longer in the vertical direction. With 8 plot windows, eZ-TOMAS will display 2 rows of 4 plot windows.
4
Align Plots, Horizontal Orientation – Affective with 2 or more plots. This function orients the plot windows such that
they are longer in the horizontal direction. With 8 plot windows, eZ-TOMAS will display 4 rows of 2 plot windows.
5
Time Waveform - Selects Plot Display window for which the x-axis is in units of time.
6
Spectrum – Selects a Plot Display window for which the x-axis is in frequency-related units.
7
Orbit – Used to plot a time waveform for a channel pair. The data will is displayed in a polar format.
8
Waterfall – Selects a Plot Display window that makes use of x, y, and z axis. Waterfall plots display data as a series of
Spectral Maps. Some users refer to Waterfall Plots as Cascades.
9
Bode – Selects a plot display window in which the x-axis is scaled in RPM.
10
Polar – Selects a window for a circular plot. Displays 1x Amp and Phase data in a polar format.
11
Stripchart – Selects a stripchart type plot display window.
12
Shaft Centerline – Used to plot a shaft centerline orbit as a trend in Gap Voltage for a channel pair. The data is
displayed in a polar format.
13
Spectral Bands – Bands A, B, C, and D are pre-defined as follows: A-Overall, B-DC
Gap Voltage, C-1xAmp/Phase, D-1xPhase/Amp. E through N are user-defined
14
Overlap Process - Calculate and Save – Opens the Overlap Processing dialog box. Overlap Processing can be used
to analyze machine transients using continuous data in the FIFO history file. This button is related to the Overlay Overlap
Data button (15).
15
Overlay Overlap Data – Use this button to plot overlap processed data onto Bode or Polar displays. The feature can be
used to compare various startup and shutdown data. This button is closely related to the
16
Show Baseline – superimposes a pre-recorded baseline on top of display data. This option is only available in the Time
or Spectrum plots. Show Baseline is typically used to compare a spectrum with another (the baseline) which was taken
when the machine was known to be in good working condition. Show baseline is only available for multiple plot
applications.