Measurement Computing eZ-TOMAS version 7.1.x User Manual
Page 55
eZ-TOMAS & eZ-TOMAS Remote
928092
Display Menu … Plot Windows 5-4
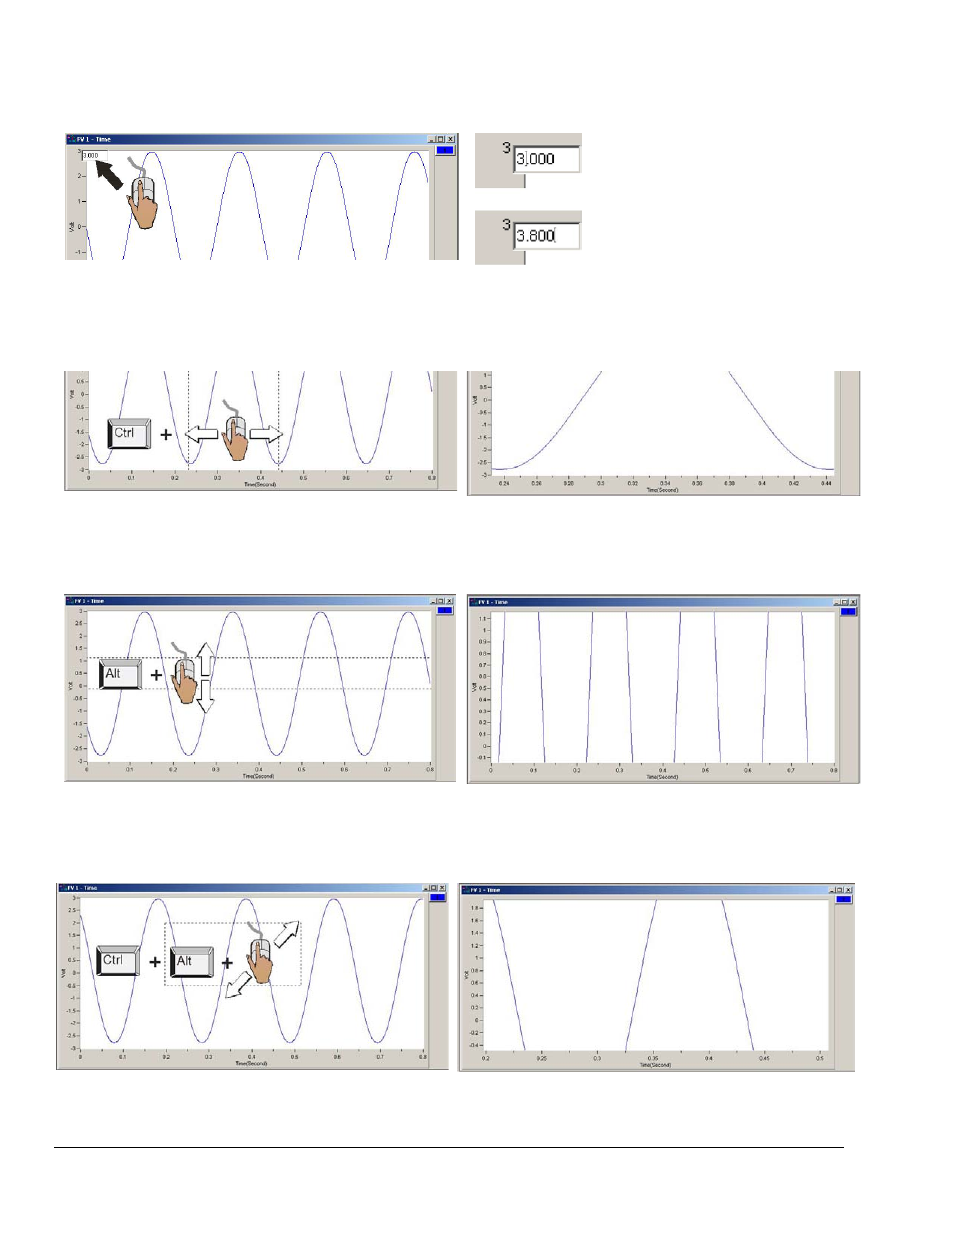
Changing Display Ranges and ScalesTo change the maximum or minimum range value (following figure): Left-click on
upper or lower scale value that is to be changed, then enter the new value. An example follows. This technique works for
both X and Y axis.
To change the X-Axis (following figures): Hold down the
cursor horizontally on the plot. Two vertical cursor lines will define the new x-axis end points. As an alternative, you can
click the X-Scaling button and then drag the mouse cursor horizontally on the plot.
To change the Y-Axis (following figures): Hold down the
cursor vertically on the plot. Two horizontal cursor lines will define the new Y-axis end-points. As an alternative, you can
click the Y-Scaling button and then drag the mouse cursor vertically on the plot.
To simultaneously change the X & Y Axes (following figures): Hold down the
left-click and drag the mouse cursor diagonally on the plot. A rectangle will define the new area of the plot. As an
alternative, you can click the X-Y-Scaling button and then drag the mouse cursor diagonally on the plot.
Note: In regard to using toolbar buttons to change axis ranges, refer to Chapter 6.
In this example, the cursor and PC
keyboard were used to change the
maximum scale value from 3.000 volts
to 3.800 volts.