Orbit displays – Measurement Computing eZ-TOMAS version 7.1.x User Manual
Page 69
eZ-TOMAS & eZ-TOMAS Remote
887491
Display Menu … Plots Plot Examples 7-8
Orbit Displays
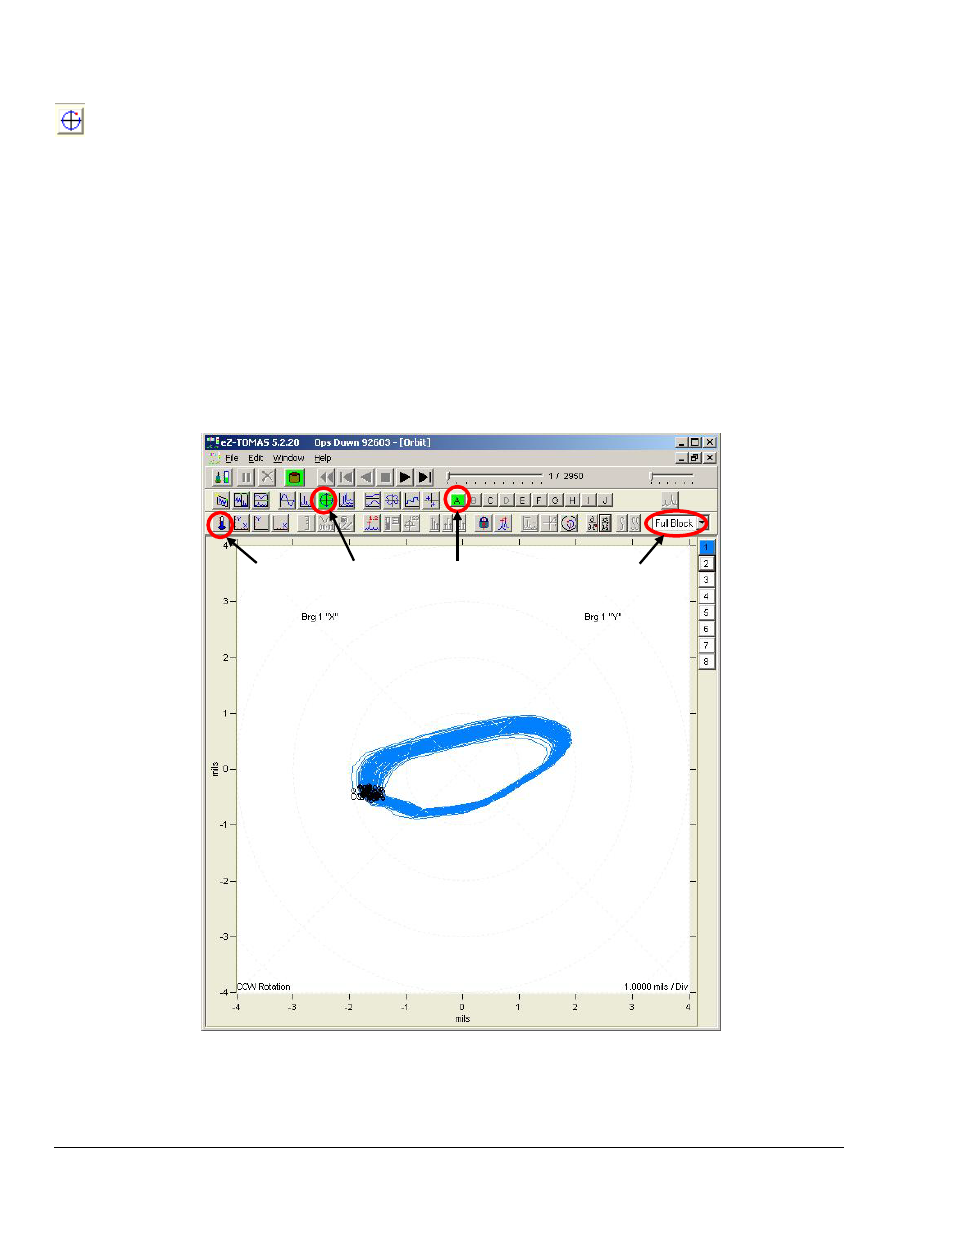
Orbit Displays show simultaneous time domain vibration amplitude for an X and Y probe pair.
The location of each Tach pulse is shown on the orbit plot using black circles; and a rotation direction label
("CCW" or "CW") is shown next to these (see figure).
The default display is “Full Block” of time data. However, a specific number of Shaft Revolutions can be
displayed (1, 2, 5, or 10) by using the associated pull-down list (see figure). The orbit display is corrected
for probe location.
You can optionally overlay the orbit onto a shaft center line display by clicking the Shaft Centerline
button. The center of the orbit trace in SCL computes the difference between the current gap voltage and
the reference gap voltage. Information regarding shaft centerline plots is presented on page 7-20.
To display an overlay of the bearing circle clearance, as indicated below (third plot), click the
Note: Only one probe pair can be shown on the Orbit Display.
Orbit, Fig. 1
- Channels 1 & 2* Unfiltered, Full Block, Instrument Scale
*
Channel 2 Pairing is from the Setup Configuration Window, Input Channels Tab, XY Pair Column
INSTRUMENT ORBIT SPECTRAL BAND A FULL BLOCK
SCALE (OVERALL, UNFILTERED)