Gauge display preferences… (ctrl+g), Plot display preferences… (ctrl+d) – Measurement Computing eZ-TOMAS version 7.1.x User Manual
Page 47
eZ-TOMAS & eZ-TOMAS Remote
887591
Edit Menu 3-21
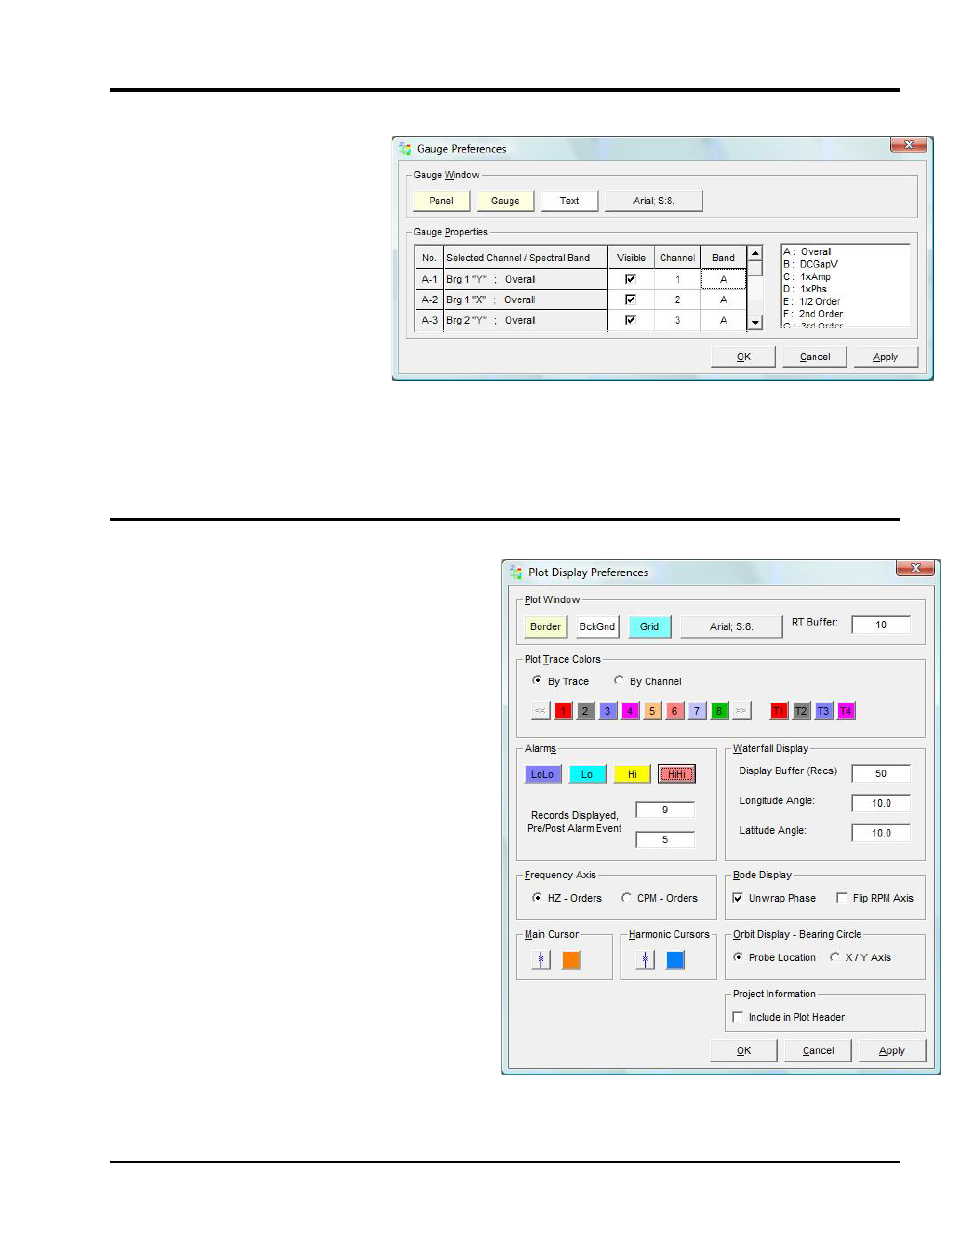
Gauge Display Preferences… (Ctrl+G)
Edit Menu
The Gauge Preferences window provides
a means of independently setting the
background colors of the control panel
and primary gauge panel. The Gauge
Preferences window includes a font
styles button which allows you to apply
a global font change to the gauge and
control panels. The lower section of the
Gauge Preferences window pertains to
Gauge Properties. In regard to the
“Bands” column, to make a change you
can drag a new Spectral Band type from
the far right into the Band column. You
can also double-click in a cell and enter
a desired Spectral Band letter (from A
through N). Channels can be edited in a
similar manner.
Note for 655 users: When a temperature channel is selected only two spectral bands will be listed at the right side of the
window. These are ‘A:Overall’ and ‘B:DCGapV.’
Plot Display Preferences… (Ctrl+D)
Edit Menu
The Display Preferences Window provides a means of
changing various display colors for the Plot Window. It
also allows you to change other display parameters,
including, but not limited to, Waterfall latitude and
longitude angles, and units for the frequency axis.
Although most display preference functionality is self-
explanatory, the following information may be useful to
some.
The Plot Window panel allows you to define the Plot
Display's border, background, grid colors, and the font
style and size. The panel includes an RT Buffer numeric
field for indicating Realtime Trend. This value defines
the amount time [in minutes] that data will be displayed
before scrolling will begin. For example, if the Realtime
Trend was set for 2 minutes the trend display would show
the data being collected for two minutes, and then start
scrolling after 2 minutes. In this example the screen will
always display the most recent 2 minutes of data.
The Plot Trace Colors panel allows you to define colors
for use in the plot displays. If you select "By Trace" the
sequential order of the Trace Number will define the plot
color. If you select "By Channel" colors will be assigned
to specific channels according to the numbered color
squares.
The Alarms panel defines alarm colors. The panel
includes two numeric fields. The upper field indicates the
number of records to be displayed. The lower field, for
Pre/Post Alarm Event, defines the amount of data that
will be displayed when using the Alarm Log report.