Time waveform displays – Measurement Computing eZ-TOMAS version 7.1.x User Manual
Page 63
eZ-TOMAS & eZ-TOMAS Remote
887491
Display Menu … Plots Plot Examples 7-2
Time Waveform Displays
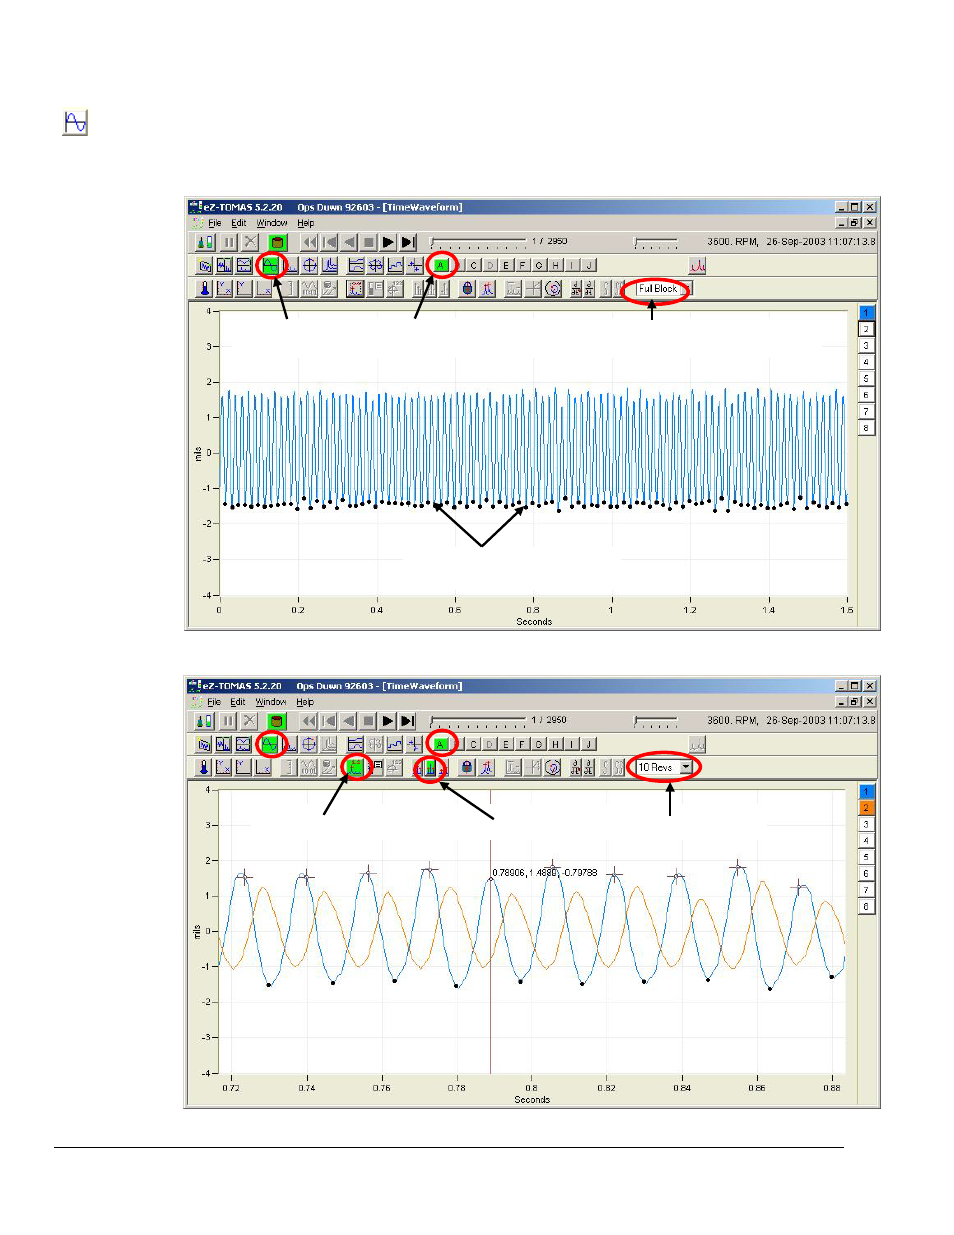
Time Waveform displays show vibration amplitude as a function of time (seconds) for a block of time
domain data. This Block is the measured data used in Spectral Displays. Note that multiple channels
can be shown on the Time Display.
Tach Pulse locations are shown with a black dot.
Time Waveform, Fig. 1
- Unfiltered, Channel 1, Full Time Block, No Cursors
Time Waveform, Fig. 2
- Unfiltered, Channels 1 and 2, 10 Revolutions, Cursor plus Sidebands
DISPLAY CURSOR VALUES SIDE BAND CURSORS 10 REVOLUTIONS
TIME WAVEFORM SPECTRAL BAND A SHAFT REVOLUTION FILTER
(OVERALL, UNFILTERED) (FULL BLOCK IS THE DEFAULT)
TACH PULSE LOCATIONS
(EACH BLACK DOT IS A LOCATION)