Measurement Computing eZ-TOMAS version 7.1.x User Manual
Page 57
eZ-TOMAS & eZ-TOMAS Remote
928092
Display Menu … Plot Windows 5-6
Reference Note:
Refer to Chapter 6 for more detailed information regarding Plot displays,
associated toolbar buttons, and other controls.
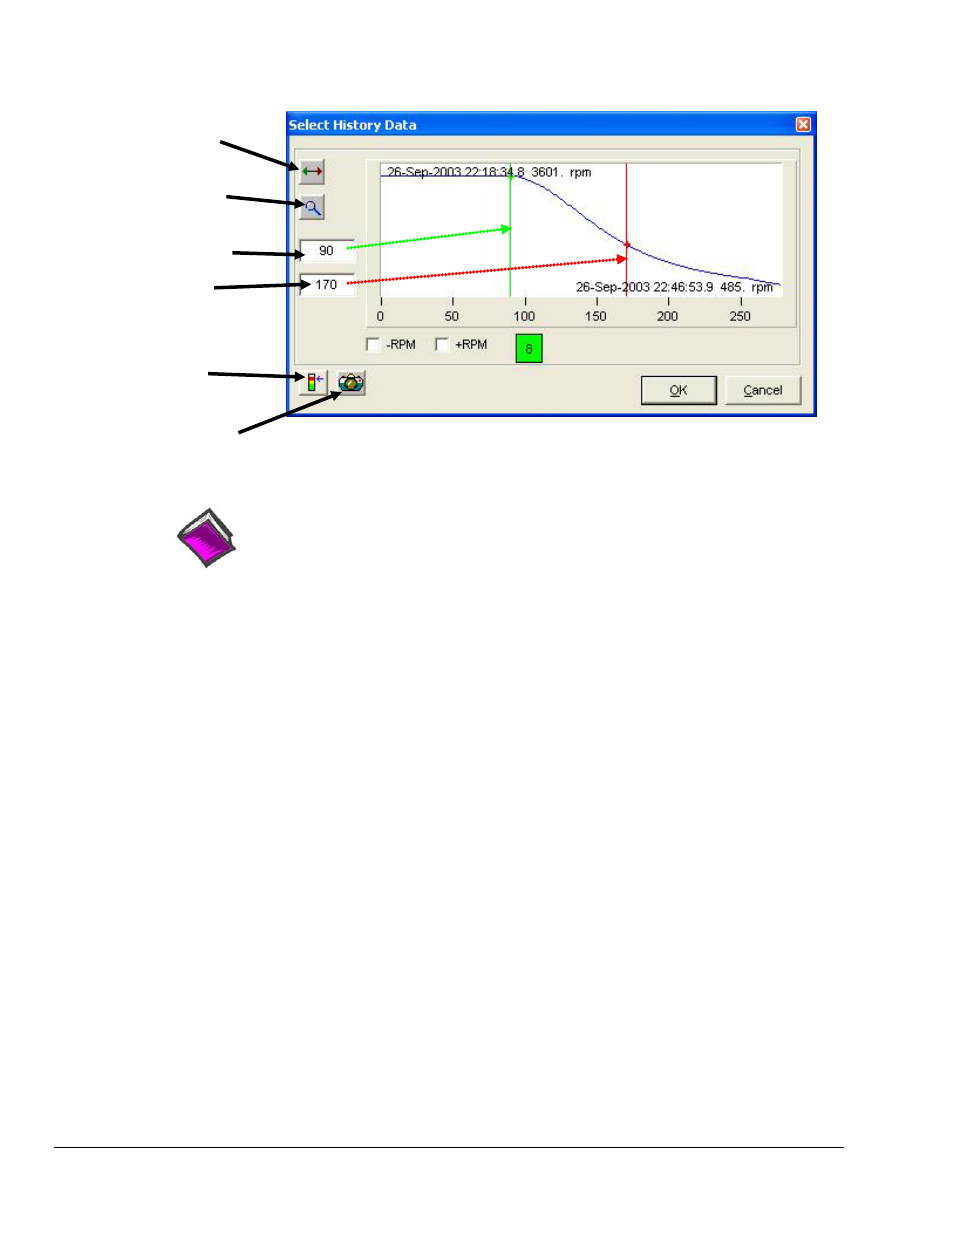
The default is the entire history file. To change the start and end dates drag the green and red bands to the
desired start and stop times, respectively. As an alternative, you can enter the record numbers in the
numeric fields for starting and ending records. After defining the range, click
From the plot window, click the play button to play back the file.
The History Data window includes a Show Alarm Log button. Click the button to open a table of alarm
events that are included in the file (if applicable). You can select an alarm event to display the data that
surrounds the event.
The History Data window also includes a Show Snapshot Log button. Click the button to open a list of
data snapshots. You can select a snapshot from the list to view it in the plot window.
RPM Filter – This feature eliminates hysterisis and is therefore useful for trend displays, e.g., Stripchart,
Polar, Shaft Centerline and Bode. If the RPM Filter checkbox is checked eZ-TOMAS will only display
data for increasing or decreasing RPM.
Resize to the
default range.
Zoom in on the
History range.
Set range
starting record.
Set range
ending record.
Show
Alarm Log
Show Snapshot
Log