Spectrum displays – Measurement Computing eZ-TOMAS version 7.1.x User Manual
Page 67
eZ-TOMAS & eZ-TOMAS Remote
887491
Display Menu … Plots Plot Examples 7-6
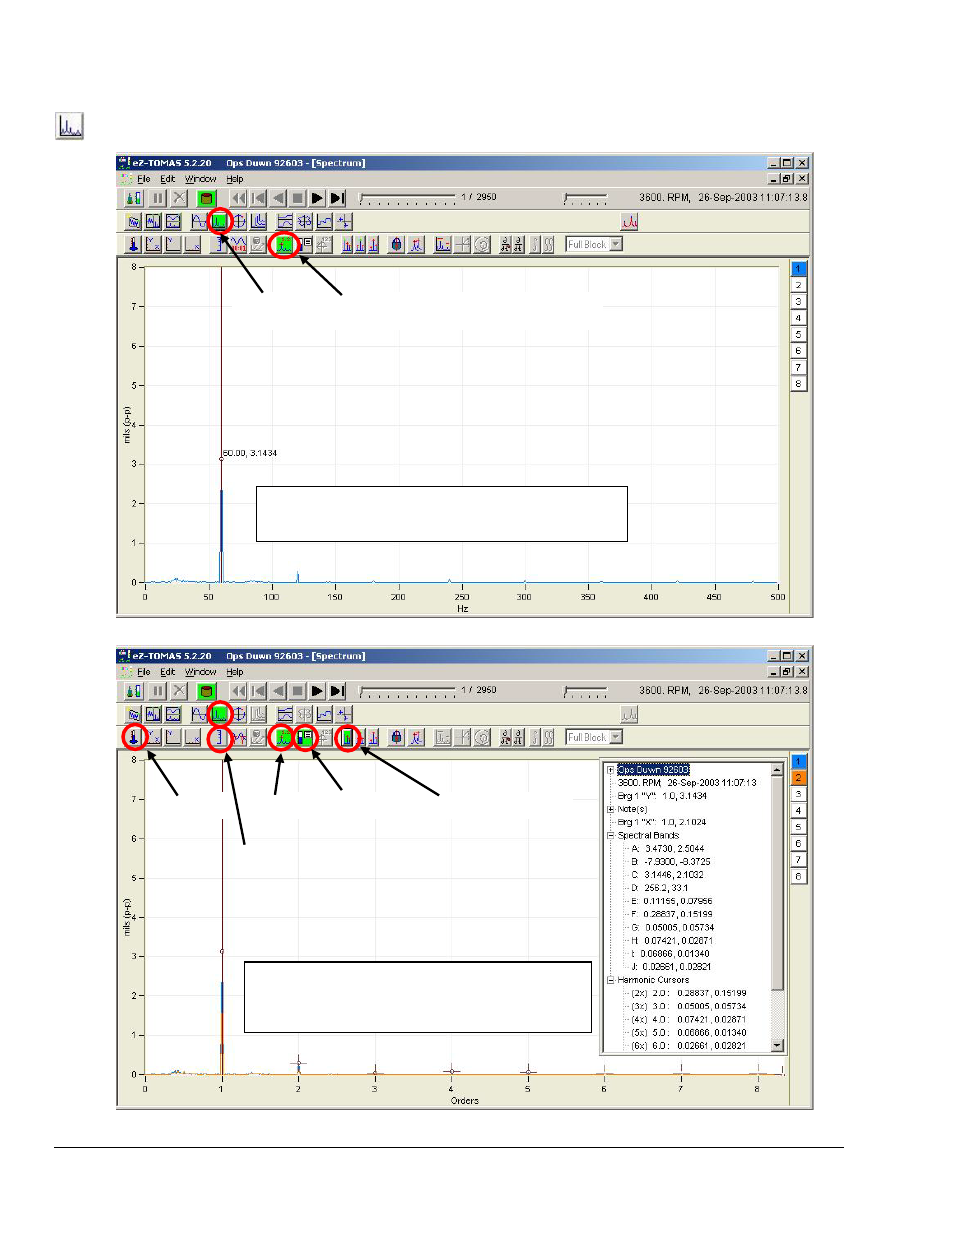
Spectrum Displays
Spectrum Displays show vibration amplitude as a function of frequency. The frequency units can be either Hertz
(Hz), cycles per minute (CPM) or orders. Multiple channels can be shown on the Spectrum Display.
SPECTRUM DISPLAY CURSOR
DISPLAY VALUES
INSTRUMENT DISPLAY SHOW FRAME HARMONIC CURSORS
SCALE CURSOR ANNOTATION
VALUES
LINEAR SCALE
Spectrum, Fig. 1
Channel 1, Instrument Scale, Cursor, and X-axis in Hz
Spectrum, Fig. 2
Chs 1 & 2, Linear Scale, Cursor + Harmonic with
Frame Annotation, X-axis is in Orders
This manual is related to the following products: