8 - display menu... reports and logs, Display menu . . . reports and logs 8, Statistical report – Measurement Computing eZ-TOMAS version 7.1.x User Manual
Page 85
eZ-TOMAS & eZ-TOMAS Remote
927692
Display Menu …. Reports & Logs 8-1
Display Menu . . . Reports and Logs
8
Statistical …… 8-1
Alarm Log …… 8-4
Snapshot Log …… 8-6
Production Test
Report …… 8-7
Configuration Setup
[.txt File]
…… 8-8
Display Pull-down Menu
eZ-TOMAS can generate the following types of logs and reports: Statistical, Alarm, Snapshot, Production
Test, and Configuration Setup text file (.txt). Note that Plot Windows, which can also be selected from the
Display pull-down menu, are discussed in Chapters 5, 6, and 7.
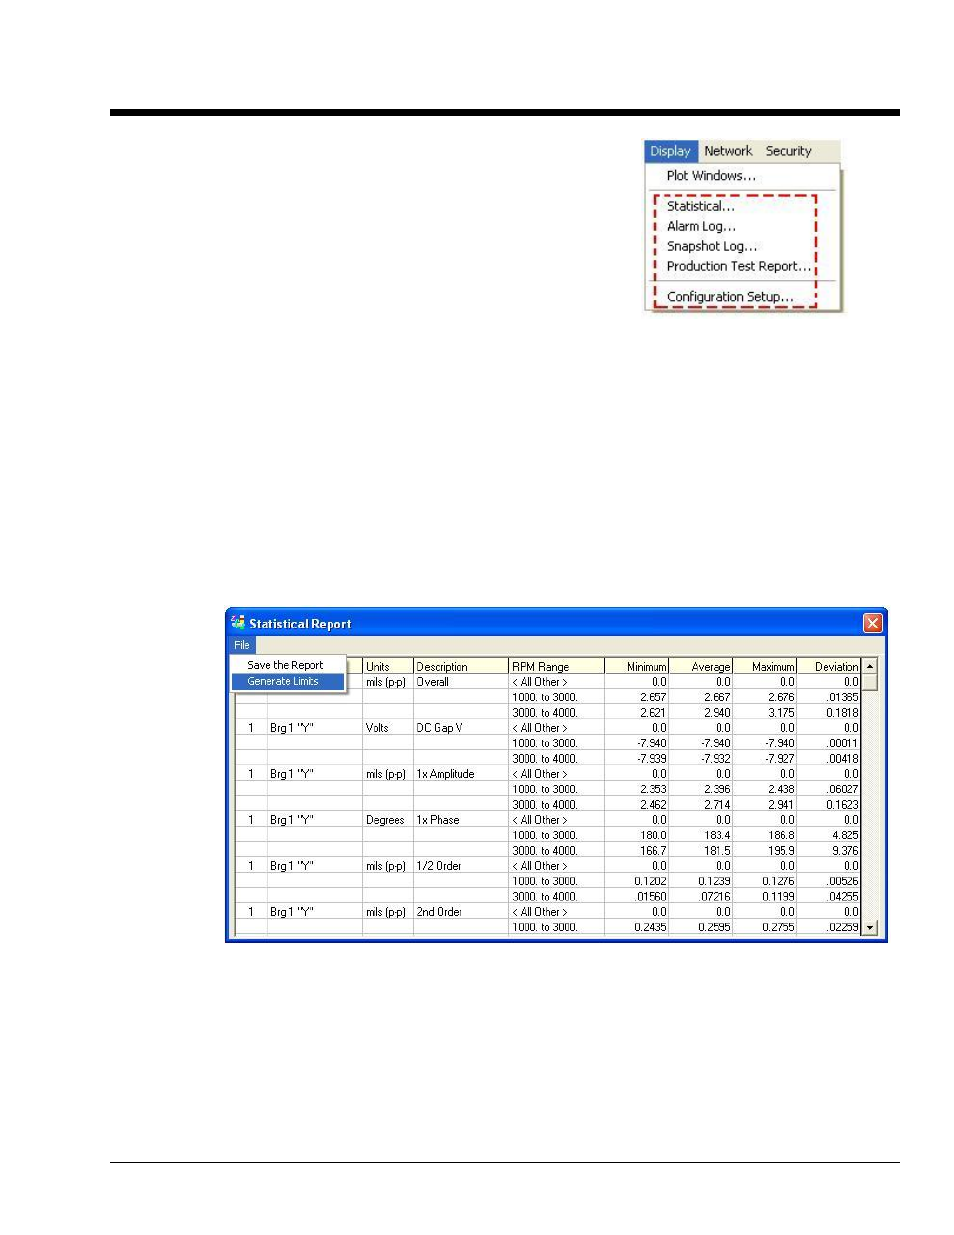
Statistical Report
The Statistical Report lists the historical spectral band data. It includes the instrument, the engineering
units, the minimum value, the mean average value, the maximum value, and the standard deviation by
channel.
The Statistical Report can be accessed from the Gauge Window’s Reports Pull-down menu.
Statistical Report
The report can be saved as an ASCII text file for further use.
This data can be used to generate or fine tune limits. Note that you can have eZ-TOMAS automatically
compute limit values by selecting Generate Limits on the File menu. You can view and modify limits by
selecting Limits in the Gauge Window’s Edit pull-down menu. Chapter 2 contains additional information.