Measurement Computing eZ-TOMAS version 7.1.x User Manual
Page 7
eZ-TOMAS & eZ-TOMAS Remote
887491
Introduction to eZ-TOMAS 1-5
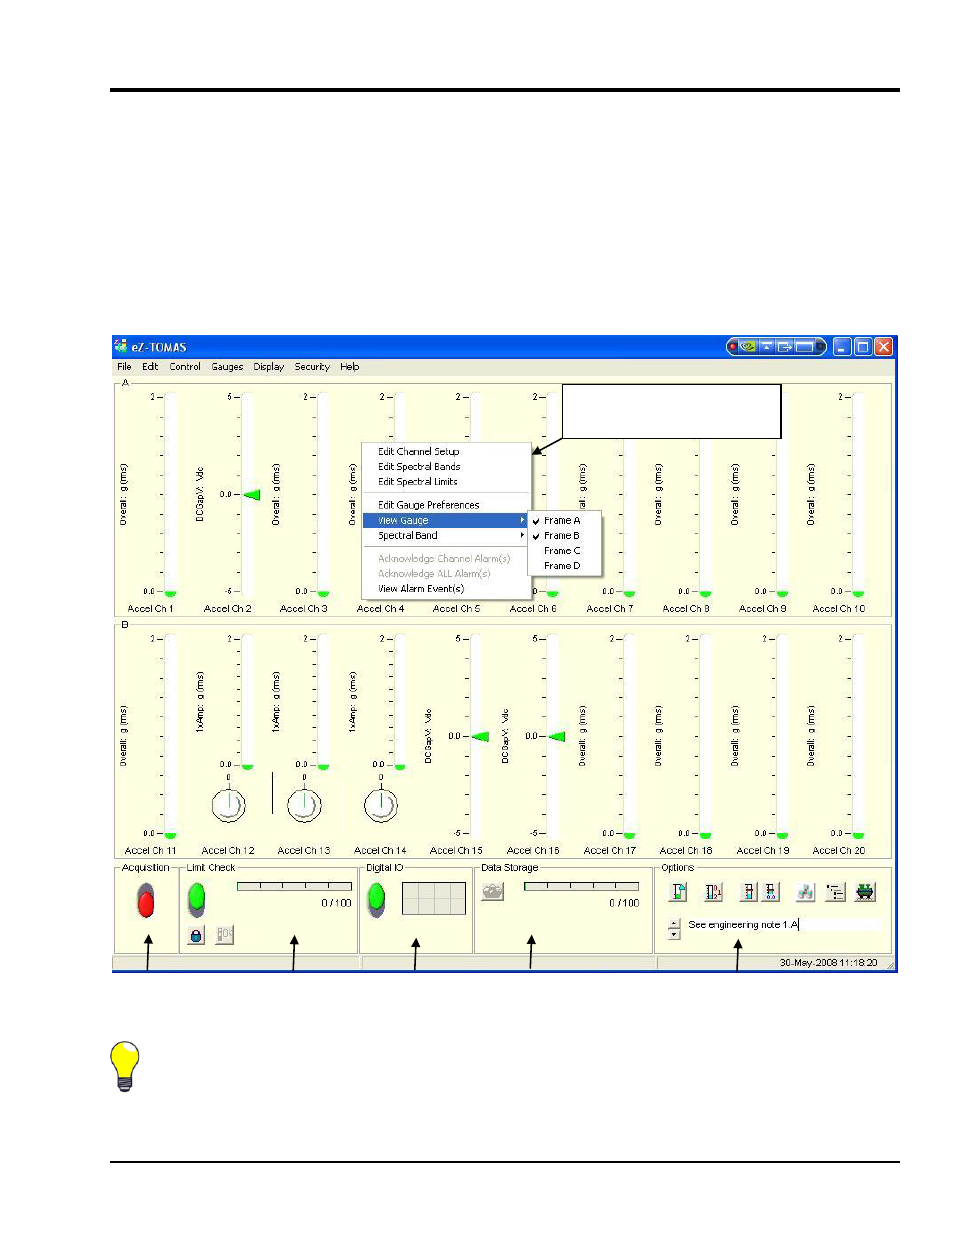
A Look at the Gauge Window & Control Pull-down Menu
The Gauge Display Window is used to show real-time values and measurement status. Gauge Display is not used for
historical data analysis. The Gauge Window in eZ-TOMAS Remote looks identical, except a Server panel is included on the
left edge of the window (see the network section of Chapter 3 for an illustration).
The main window of the GUI (graphical user interface) includes a set of virtual gauges, which use one of 14 spectral bands,
discussed shortly. There will always be a vertical gauge associated with each input channel. When the 1x Amp/Phase
selection is made, spectral bands for “1x Amplitude” and “1x Phase” are simultaneously displayed, with the later being in a
circular phase gauge (see second figure).
In addition to spectral band gauge displays, eZ-TOMAS can interactively display data in a variety of other formats,
including: Orbit, Polar, Time, Bode, Cascade/Waterfall, Strip Chart, and Shaft Centerline. You can control the acquisition
through toggle switches on the lower panels or through the Control pull-down menu.
Gauge Window Display - Various Spectral Bands
Tip: You can use the mouse to accomplish the following.
o
Double-click the left-mouse button on an area of the gauge window to access a plot display window.
o
When limit pointers are used for a vertical gauge you can use the mouse to drag them to new positions, thus setting
new limit values.
o
When applicable, you can drag limit-lines on circular phase gauges to new positions, thus setting new values for the
phase angle limits.
o
Right-click on an area of the gauge window to bring up a menu with several edit options (see frame A in figure).
Acquisition Limit Check Digital I/O Data Storage Options
Right-click on the panel to
access the pop-up menu.