Waterfall displays – Measurement Computing eZ-TOMAS version 7.1.x User Manual
Page 73
eZ-TOMAS & eZ-TOMAS Remote
887491
Display Menu … Plots Plot Examples 7-12
Waterfall Displays
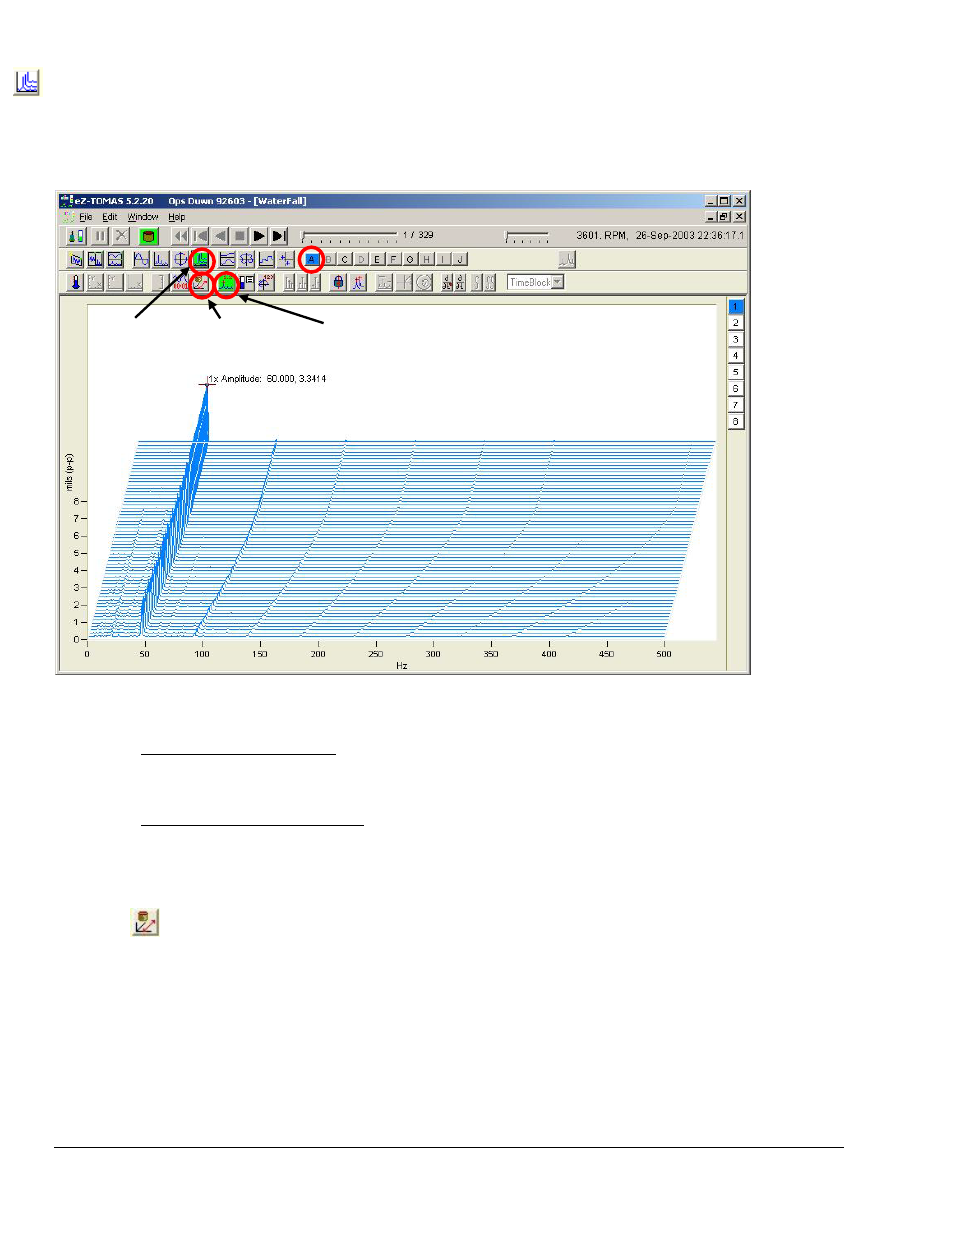
Waterfall Displays show a series of Spectrums on a 3D graph. The X-axis is Frequency either Hz or CPM. The Y Axis is
Vibration Amplitude. And the Z Axis is time. Three examples follow.
Waterfall, Fig. 1
- Channel 1, Scrolling Buffer, Cursor
To adjust the Latitude Angle (Vertical Pitch) of the Waterfall display, Right Click in the Y-axis area and enter a value
between 0 and +75 degrees. This is indicated in the upper left corner of the display (see figure). Unless you right-click
in the Y-axis region, this feature will remain hidden.
To adjust the Longitude Angle (Horizontal Pitch) of the Waterfall display, Right Click in the X-axis area and enter a value
between -75 and +75 degrees. This is indicated in the lower right corner of the display (see figure). Unless you right-click
in the X-axis region, this feature will remain hidden.
*Note:
Use All Records or Skip Records – When Waterfall is selected this button determines which one of two display
modes will be in effect.
o
Show Entire Range (Use All Records): When the button is gray, as indicated above, “Use all Records” is
selected and the entire Waterfall will scroll. Scrolling can be forward or backward.
o
Skip History Record: When the button is green a maximum of 100 records will be scrolled based on a Skip
Record Factor. SRF = History Records / Waterfall Records - 1. Thus if we had 634 history records and 100
waterfall records we would have a skip factor of 6.4 records, i.e., 634 / 100-1 = 6.4 records. This skip factor would
result in 100 records being scrolled. Note that the SRF is automatically calculated and applied by software.
Waterfall Figure 3 is an example of Skip History Record.
WATERFALL SCROLL THRU DISPLAY CURSOR
ALL RECORDS
*
VALUES