Brookfield DV2+Pro Viscometer User Manual
Page 60
Brookfield Engineering Labs., Inc.
Page 60
Manual No. M03-165-F0612
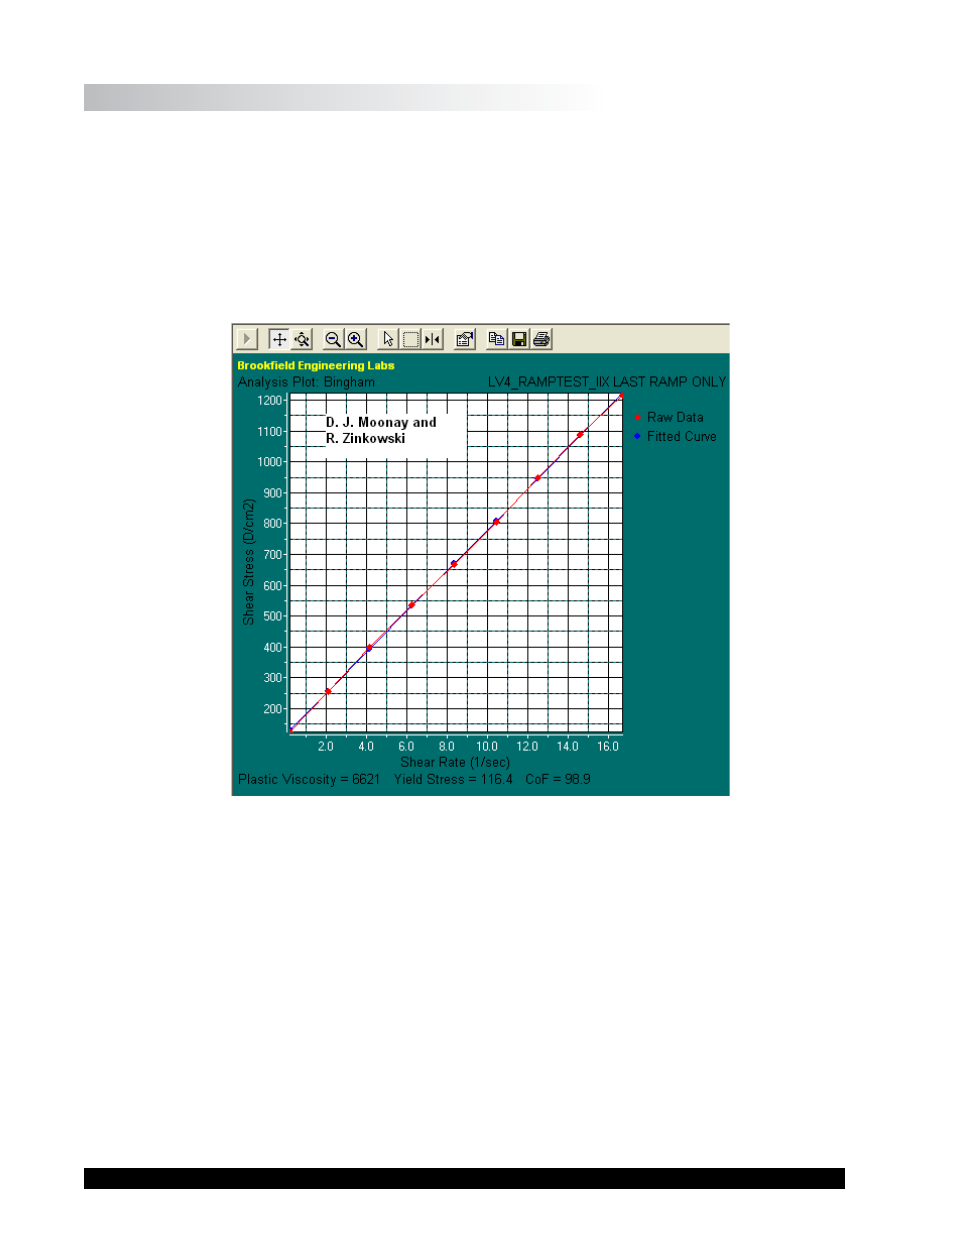
V1.3.3 The Bingham Model
τ = τ° +
h
D
(
= shear stress,
τ°
= yield stress, h = plastic viscosity, and D = shear rate)
What does it tell you?
The Bingham model indicates a product’s yield stress, τ° , which is the amount of shear stress
required to initiate flow. It also provides the plastic viscosity,
h
, which is the viscosity after a
product yields.
Figure V1-16
When should you use it?
This model should be used with non-Newtonian materials that have a yield stress and then behave
in a Newtonian fashion once they begin to flow. As a result, the shear stress-shear rate plot forms
a straight line after yielding. (Products that have a yield stress only begin to flow after a certain
amount of shear stress is applied. They are also called “viscoplastic”. Their shear stress vs. shear
rate graphs intersect the y-axis at a point greater than 0.)