20060301
7-5-3
Graphing Paired-Variable Statistical Data
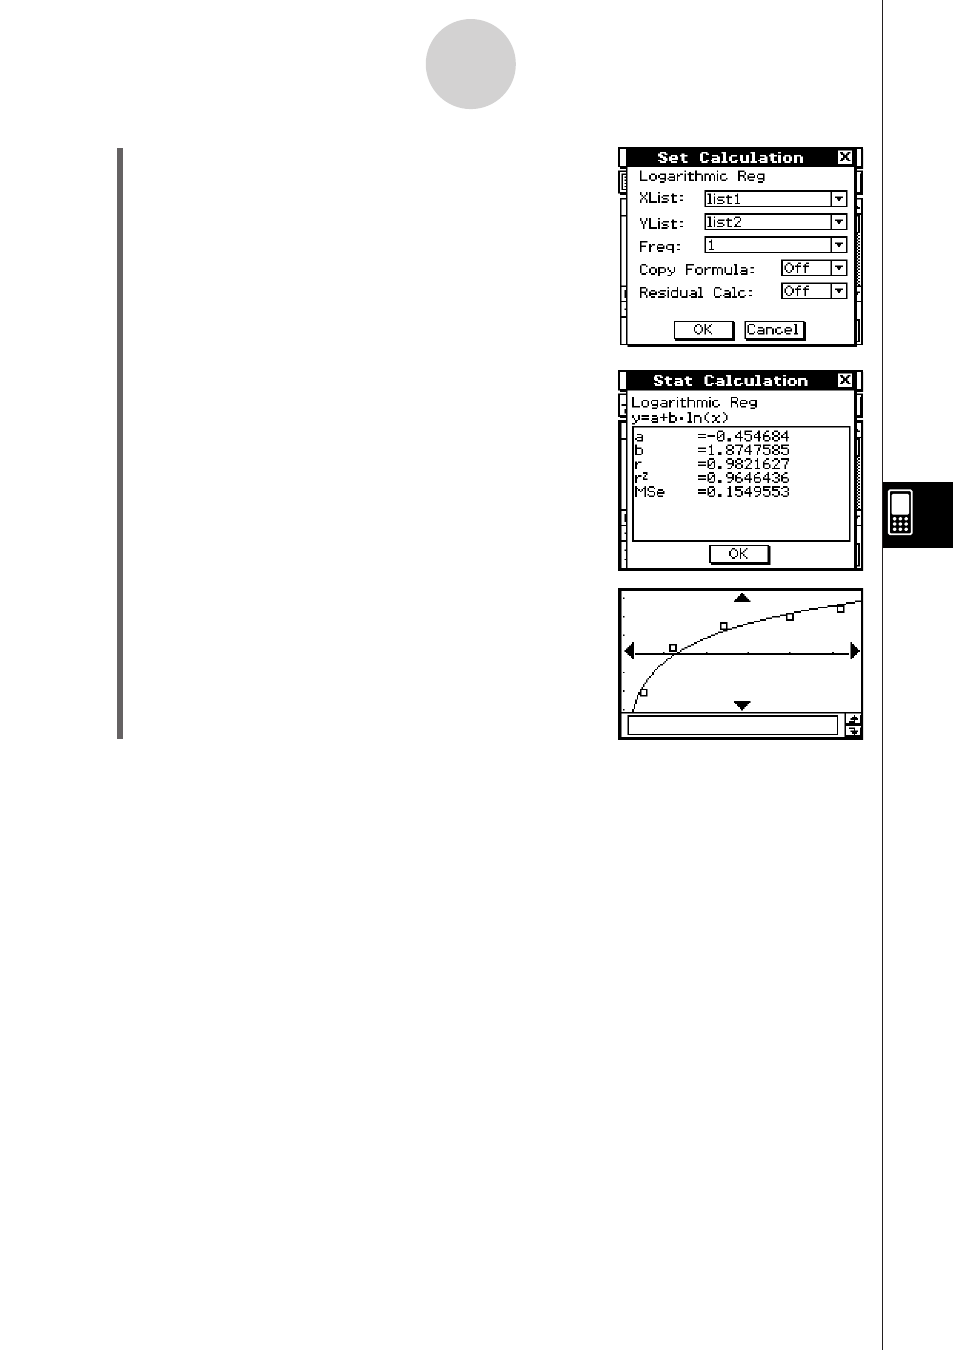
(6) Tap [Calc] [Logarithmic Reg].
(7)
Tap
[OK].
(8)
Tap
[OK]
.
Tip
• You can perform trace (page 3-7-1) on a regression graph. Trace scroll, however, is not
supported when a scatter diagram is displayed.