Saving the document, Viewing the data, Viewing data in the frequency domain – Bird Technologies BDS-Manual User Manual
Page 37: Figure 11 viewing data in the frequency domain, Saving the document viewing the data
23
Saving the Document
1.
Select "File->Save As…" from the main menu.
Note: If the data will be analyzed using another application such as MS Excel
or MATHCAD, it’s recommended that the document is saved in the “true” CSV
file format. The “true” CSV format saves the data in a format that is more easily
interpreted than the “BDS Capture Files” format.
2.
Select “CSV Files (*.csv)” from the “Save as type:” drop-down list.
Note: The file format can also be selected in the auto save options. Auto save
options can be set up by selecting “Mode->Options…” from the main menu.
Viewing the Data
Data can be viewed while it’s being collected or after a data acquisition completes. The data is displayed in the fol-
lowing formats:
•
Frequency-Domain View
•
Table of Peaks
These views can be accessed and switched at any time by:
•
Selecting a different view using the buttons on the View tool bar.
•
Right-clicking anywhere on a view and choosing from the pop-up menu.
•
Selecting View and your choice from the main menu.
Note: View options are available by selecting “View->Options…” from the main menu or by right clicking
anywhere on a view and selecting “Options…” from the pop-up menu.
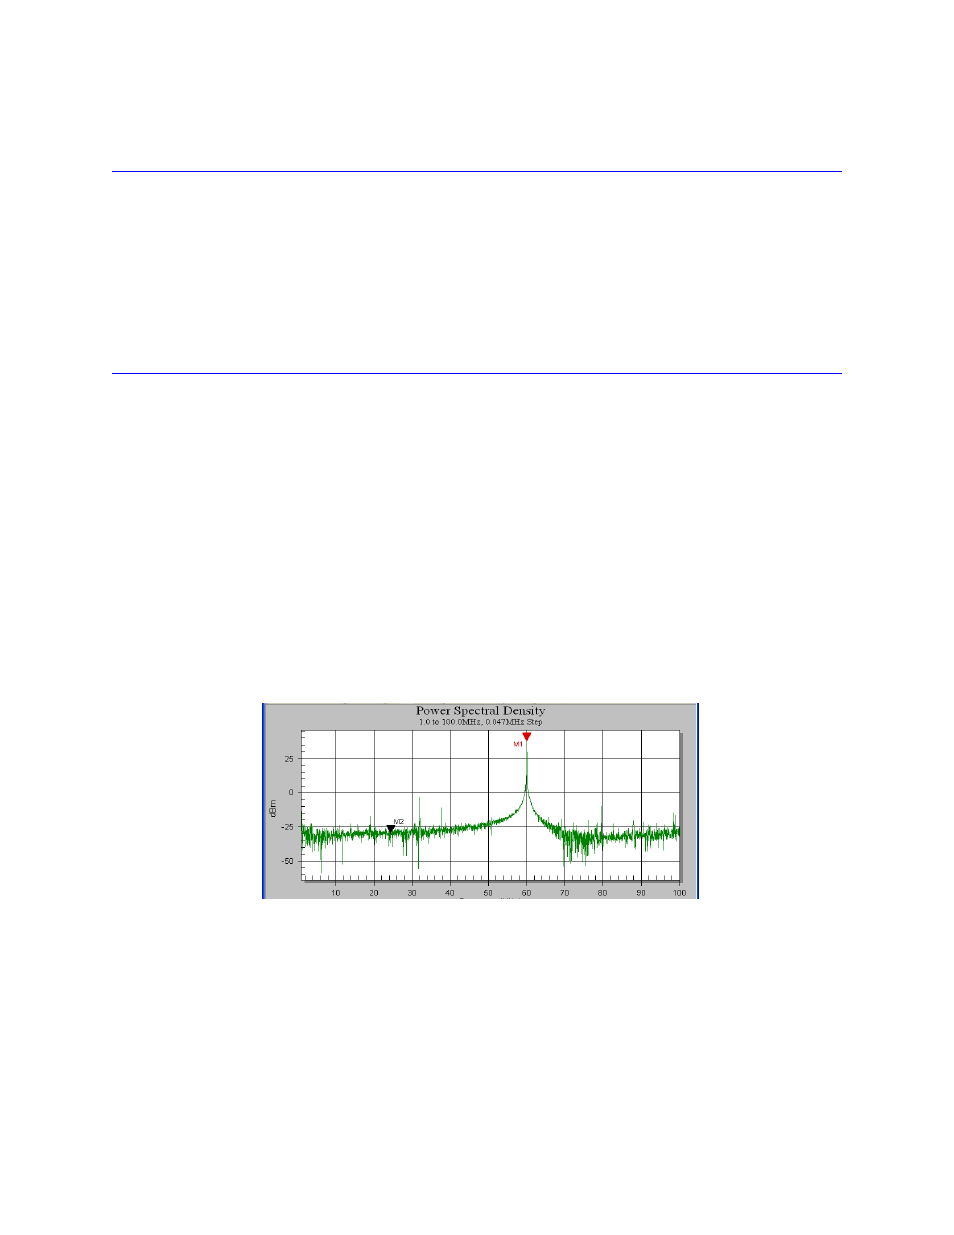
Viewing Data in the Frequency Domain
Figure 11 Viewing Data in the Frequency Domain
Note: Each data point is displayed as amplitude over frequency, with frequency on the x-axis.
Amplitude display formats can switched by right-clicking on the graph and selecting one of the format types from
the pop-up window:
•
Voltage
•
Current
•
Impedance
•
Watts
•
dBm.
Note: Format type can also be selected from the Spectral Search Options.