Rockwell Automation 1441-DYN25-Z Dynamix 2500 Data Collector User Manual
Page 147
Rockwell Automation Publication 1441-UM001B-EN-P - September 2012
147
Collecting and Reviewing Data Chapter 5
• If you set Fast Averaging to On in the Instrument Configuration screen,
the Dynamix collects the specified number of averages before displaying
the spectrum on the screen.
• If Fast Averaging is set to Off, the Dynamix displays the spectrum while
collecting the averages. The number of averages appears in the middle of
the screen.
3.
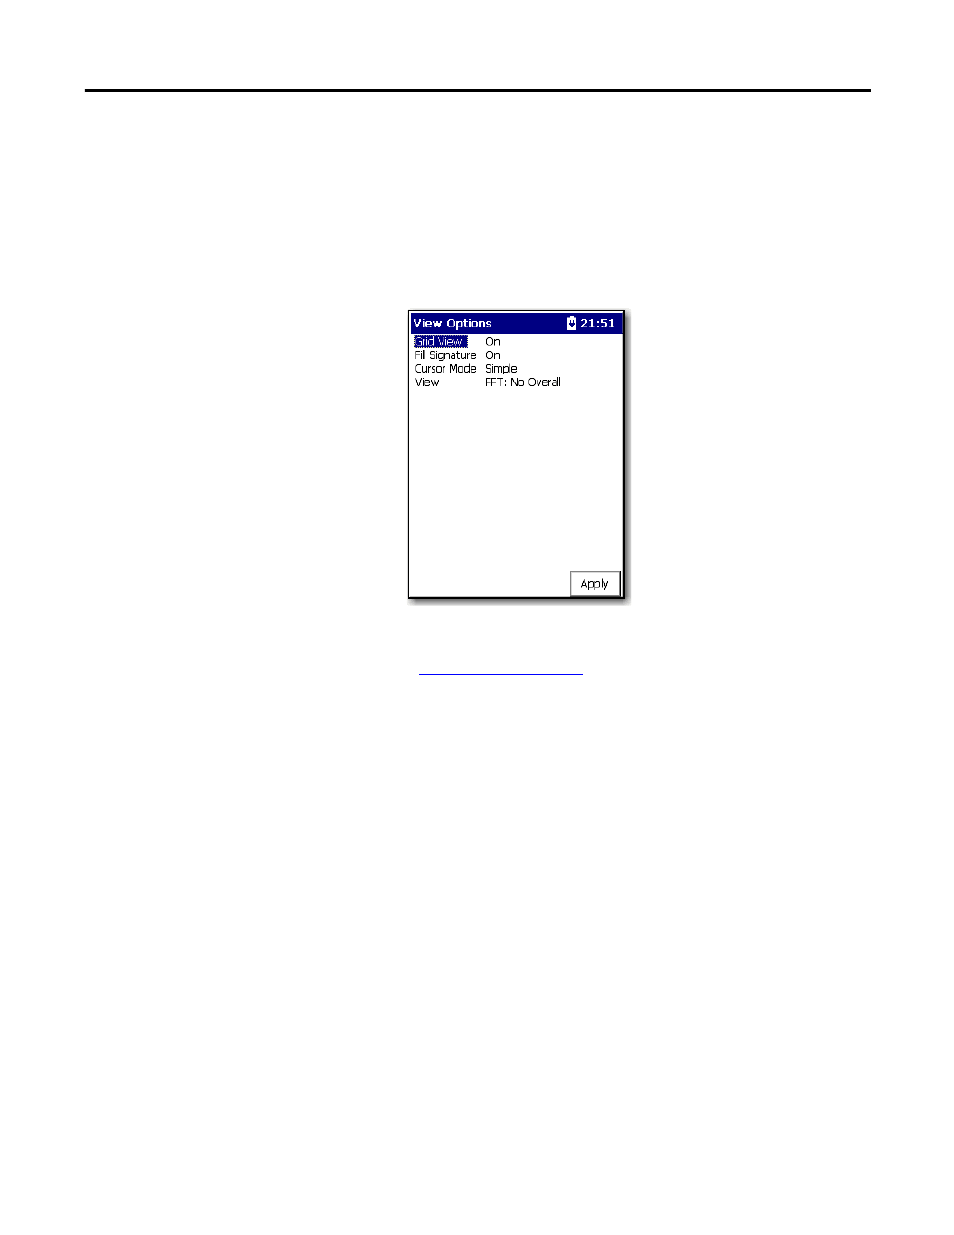
Press 0 (Shift) to display more functions and press F4 (View)
4.
Press Enter to continue to the next point.
for more information about the Signature
Spectrum.
Exceptions
Two exceptions exist for combining measurement definitions. The Emonitor
software and the Dynamix 2500 data collector cannot combine magnitude +
phase measurements with any other measurements. Nor can they combine
manual entry measurements with any other measurements. Both types remain as
individual measurements when loaded into the Dynamix 2500 data collector.
The Emonitor software can calculate an overall value from a spectrum
measurement. Under some conditions, this value may not be the same as the
magnitude measurement for the same location. These are the common uses:
• The measurement filter is not the same for the magnitude and the
spectrum measurement definitions. In this case the two measurement
definitions are measuring different frequency ranges.
• The magnitude readings taken by the Dynamix 2500 data collector are
broadband readings and are not based on the spectrum data.