C. resource management tool, 1 execute resource management tool, 2 system resource overview – EZWatch Evolution User Manual
Page 115
C. Resource Management Tool
The Resource Management Tool detects whether the system is operational.
Note:
For further application of the Resource Management Tool, please refer to page 50 In “Guard” chapter.
1.1 Execute Resource Management tool
Step 1:
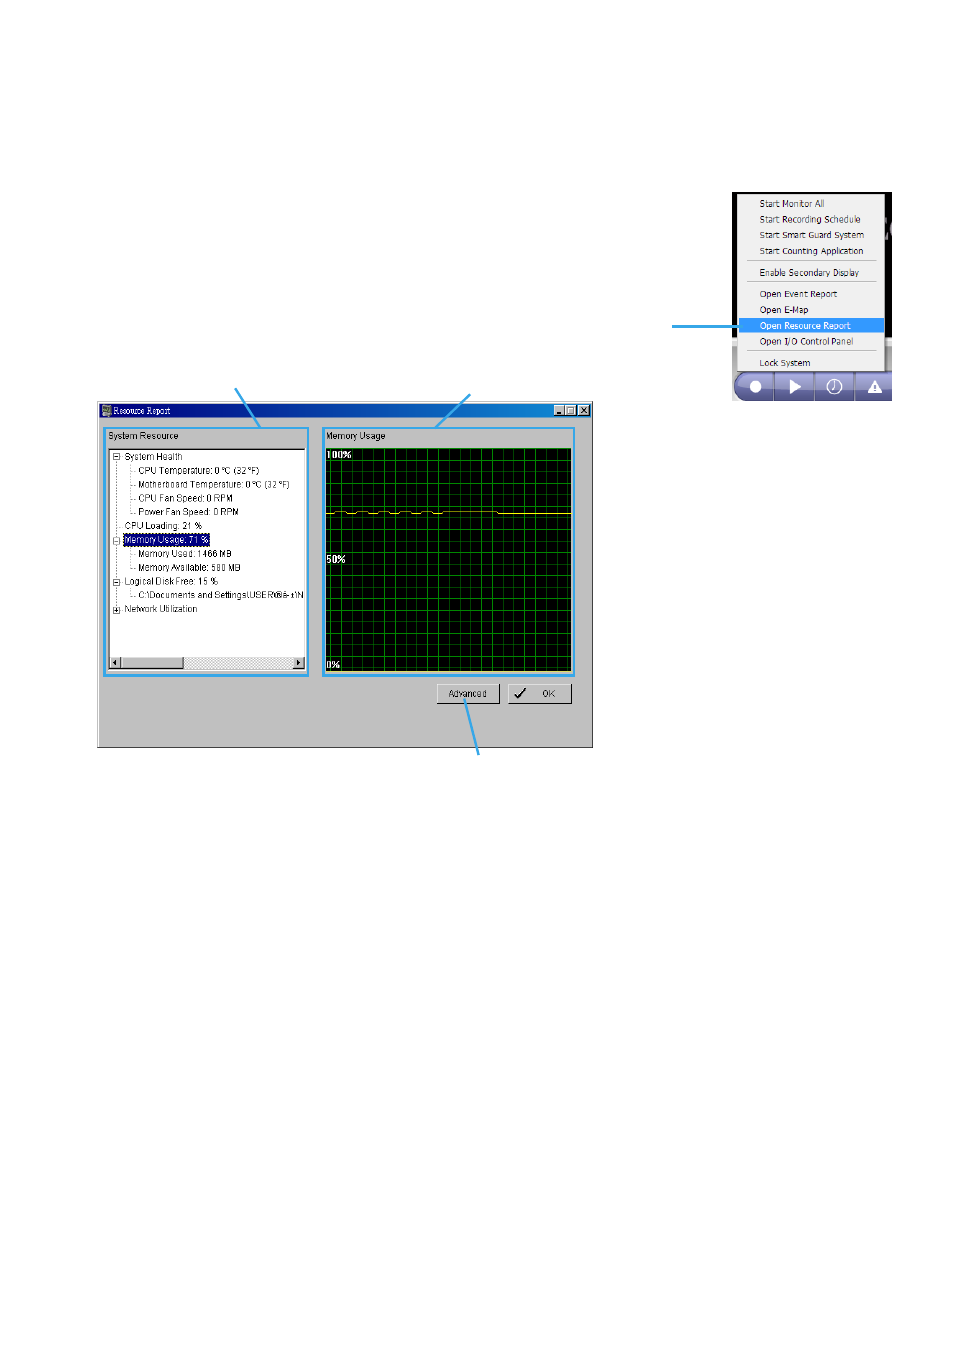
Open Resource Report from start menu.
Step 2:
The Resource Management Tool will appear.
1.2 System Resource Overview
1.2.1 System Resource
System Health:
This item shows the system information, including “CPU Temperature”, “Motherboard
Temperature”, “CPU Fan Speed” and “Power Fan Speed”.
Note:
User needs to install the “SpeedFan” first to gather the CPU and Motherboard temperature information.
CPU Loading:
This item shows the percentage of CPU usage.
Memory Usage:
This item shows the memory usage of system. “Memory Used” and “Memory Available” are
included.
Logical Disk Free:
This item shows the percentage of available disk space for storage.
Note:
The disk directory will be the same as the one in MainConsole – Config – Setting – Storage - Location.
Network Utilization:
This item shows the total bit-rate utilization for the upload and download of the computer.
1.2.2 Instant Diagram
Click each item in the list to obtain the instant system diagram. The “system resource” will be displayed as
each variable in Vertical Axis; the unit of Horizontal Axis will be displayed as “Per Second”.
Step 1
Advanced
History Diagram
System Resource