Displaying the connection history report – HP StorageWorks Enterprise File Services WAN Accelerator User Manual
Page 144
144
6 - D
ISPLAYING
AND
C
USTOMIZING
HP EFS WAN A
CCELERATOR
M
ANAGER
R
EPORTS
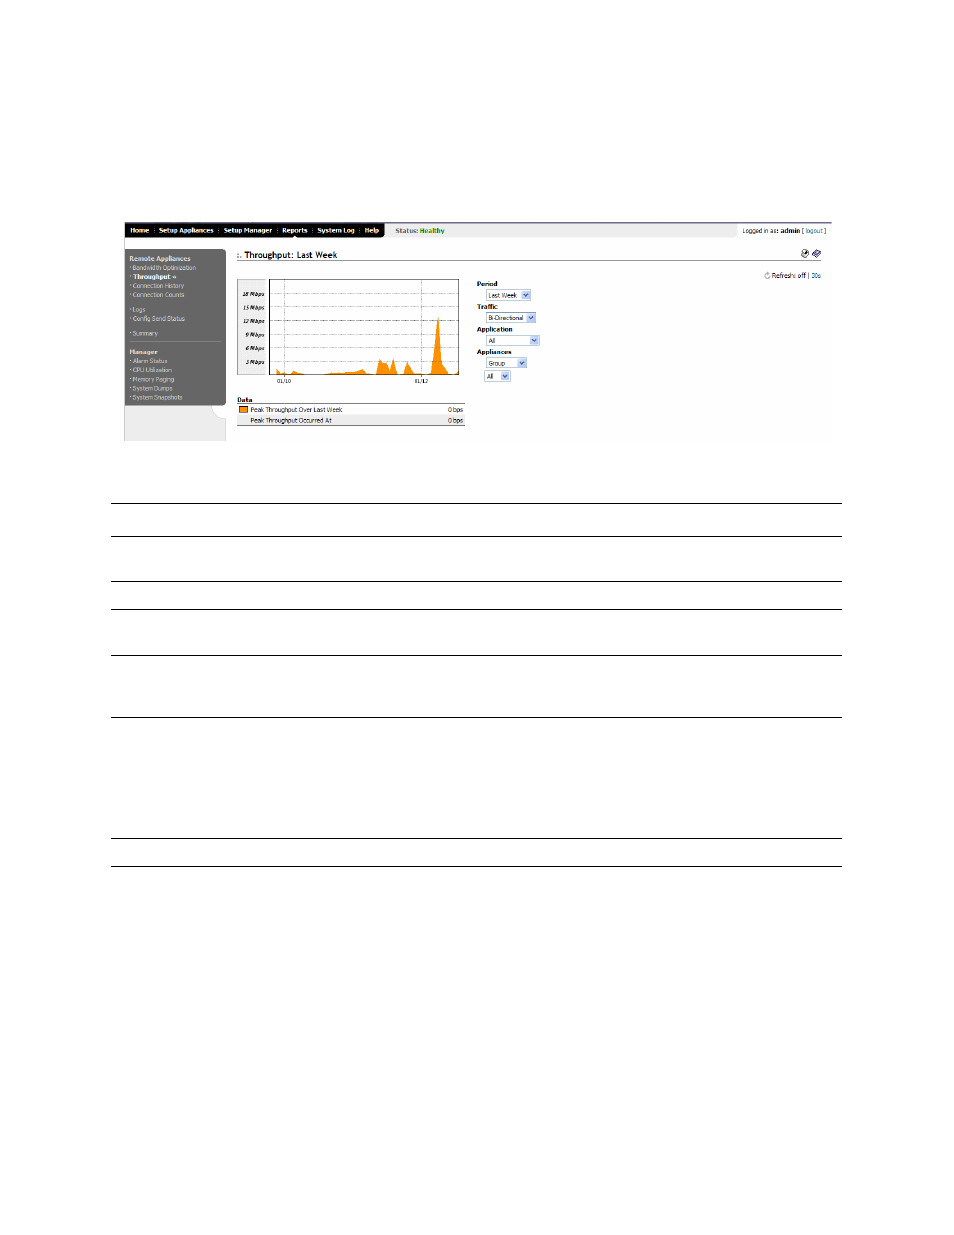
To display the
Throughput report
1. Click the Reports tab to display the Reports menu.
2. Under Remote Appliances in the left menu, click Throughput to display the
Remote Appliances - Throughput page.
Figure 6-2. .Reports: Remote Appliances - Throughput Page
3. Use the controls to customize the report, as described in the following table.
Displaying the
Connection
History Report
You display and customize the Connection History report in the Connection History
page.
Control
Description
Period
Select Last Hour, Last Day, Last Week, or Last Month from the Period drop-down
list.
Traffic
Select Bi-directional, WAN-to-LAN, or LAN-to-WAN from the drop-down list.
Application
Select FTP, HTTP, CIFS:NetBIOS, CIFS:TCP, or MAPI from the drop-down list. The
default value is All.
Appliances
The default is to include all appliances. To set a custom group, click All and use the
dialog box to select an appliance, a group, or a custom selection of appliances to include
in the report.
Refresh
Set a rate to refresh the report display:
• To refresh your report every 15 seconds, click 15s.
• To refresh your report every 30 seconds, click 30s.
• To turn off refresh, click off.
Note: The refresh rate does not affect polling. Polling occurs every 5 minutes.
Printer icon
To print your report, click the Printer icon in the upper right corner of the page.