12 heater on-time ratio, 13 oxygen concentration (with time constant), 14 maximum oxygen concentration – Yokogawa Integral Oxygen Analyzer ZR202 User Manual
Page 115: 15 minimum oxygen concentration, 16 average oxygen concentration, 17 span and zero correction ratios
<10. Other Functions>
10-6
IM 11M12A01-04E
10.1.12 Heater On-Time Ratio
The probe sensor is heated to and maintained at 750°C. When the sample gas temperature is high,
the amount of heater ON-time decreases.
10.1.13 Oxygen Concentration (with time constant)
When the output damping is specified in the mA-output range setting, the corresponding time constant
is also displayed.
10.1.14 Maximum Oxygen Concentration
The maximum oxygen concentration and the time of its occurrence during the period specified in the
Averaging display are displayed. If the setup period elapses, the maximum oxygen concentration that
has been displayed so far will be cleared and a new maximum oxygen concentration will be displayed.
If the setup period of time is changed, the current maximum oxygen concentration will be displayed
(for more details, see Section 8.7.2 earlier in this manual).
10.1.15 Minimum Oxygen Concentration
The minimum oxygen concentration and the time of its occurrence during the period specified in the
Averaging display are displayed. If the setup period elapses, the minimum oxygen concentration that
has been displayed so far will be cleared and a new minimum oxygen concentration will be displayed.
If the setup period of time is changed, the current minimum oxygen concentration will be displayed (for
more details, see Section 8.7.2 earlier in this manual).
10.1.16 Average Oxygen Concentration
The average oxygen concentration during the periods over which average values are calculated is
displayed. If the setup period elapses, the average oxygen concentration that has been displayed so
far will be cleared and a new average oxygen concentration will be displayed. If the setup period of
time is changed, the current average oxygen concentration will be displayed (for more details, see
Section 8.7.2 earlier in this manual).
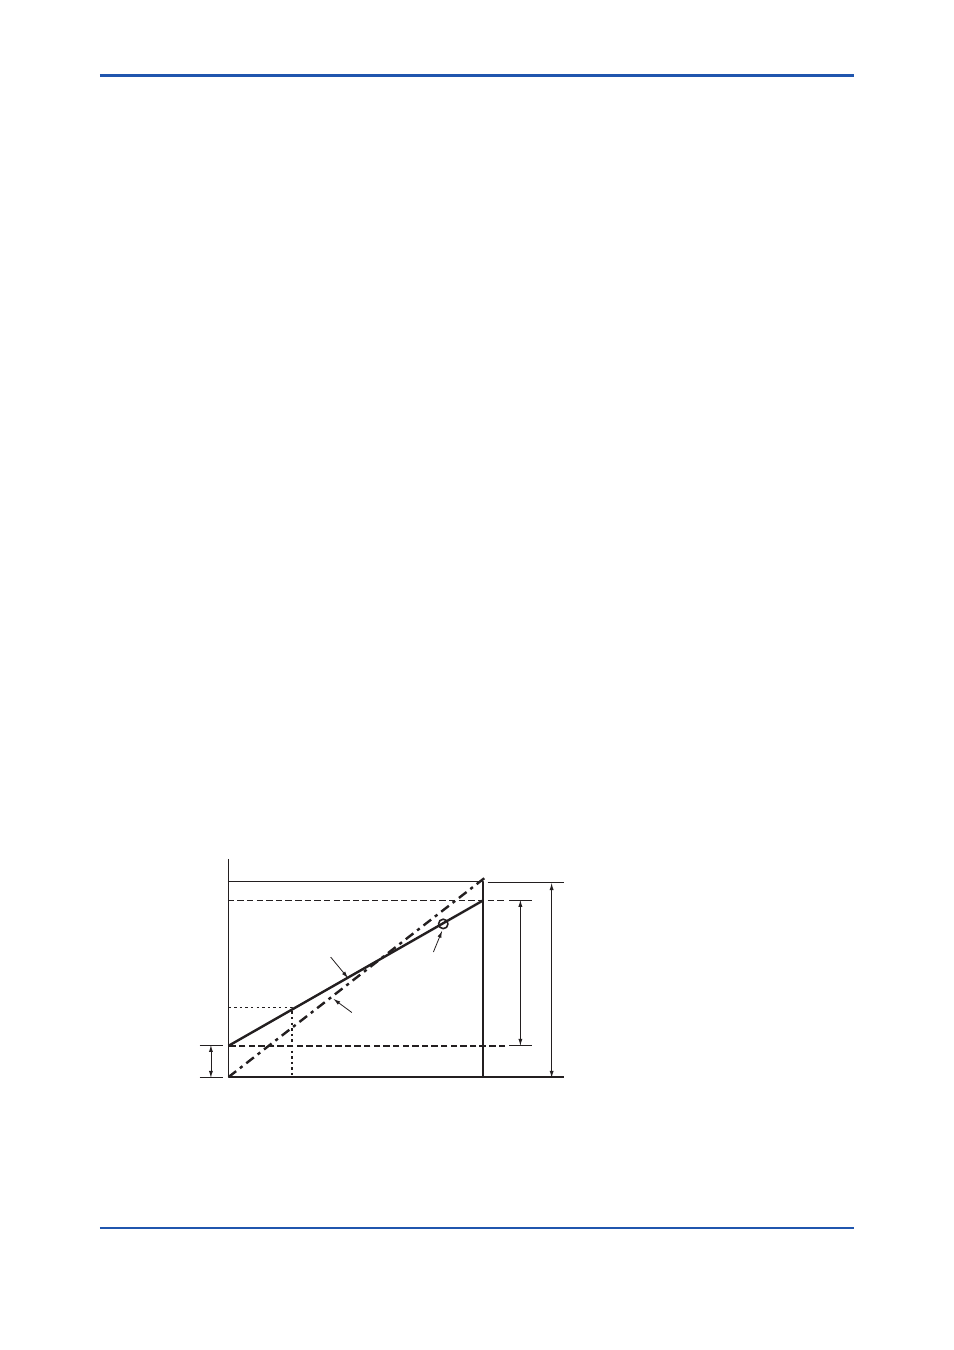
10.1.17 Span and Zero Correction Ratios
Span and zero correction ratios for the past ten calibrations are recorded to enable you to check the
degradation of the sensor (cell). If the correction ratio is beyond the limits as shown in Figure 10.2, the
sensor should no longer be used.
These ratios can be found by calculating the data as shown below.
21.0
p1
0.51
81.92
ez
e1
es
0
C
A
B
Zero correction ratio = (B/A) x 100 (%) Correctable range: 100 ± 30%
Span correction ratio = (C/A) x 100 (%) Correctable range: 0 ± 18%
Cell
electromotive
force, mV
Calibration curve
before correction
Previous
zero gas data
Corrected calibration curve
(theoretical calibration curve)
Zero origin
Span origin
Span gas concentration
Oxygen concentration (vol%O
2
)
F10.2E.ai
Figure 10.2