Displaying detailed port statistics, Figure 103: qos control list status – LevelOne GSW-4876 User Manual
Page 222
C
HAPTER
5
| Monitoring the Switch
Displaying Information About Ports
– 222 –
W
EB
I
NTERFACE
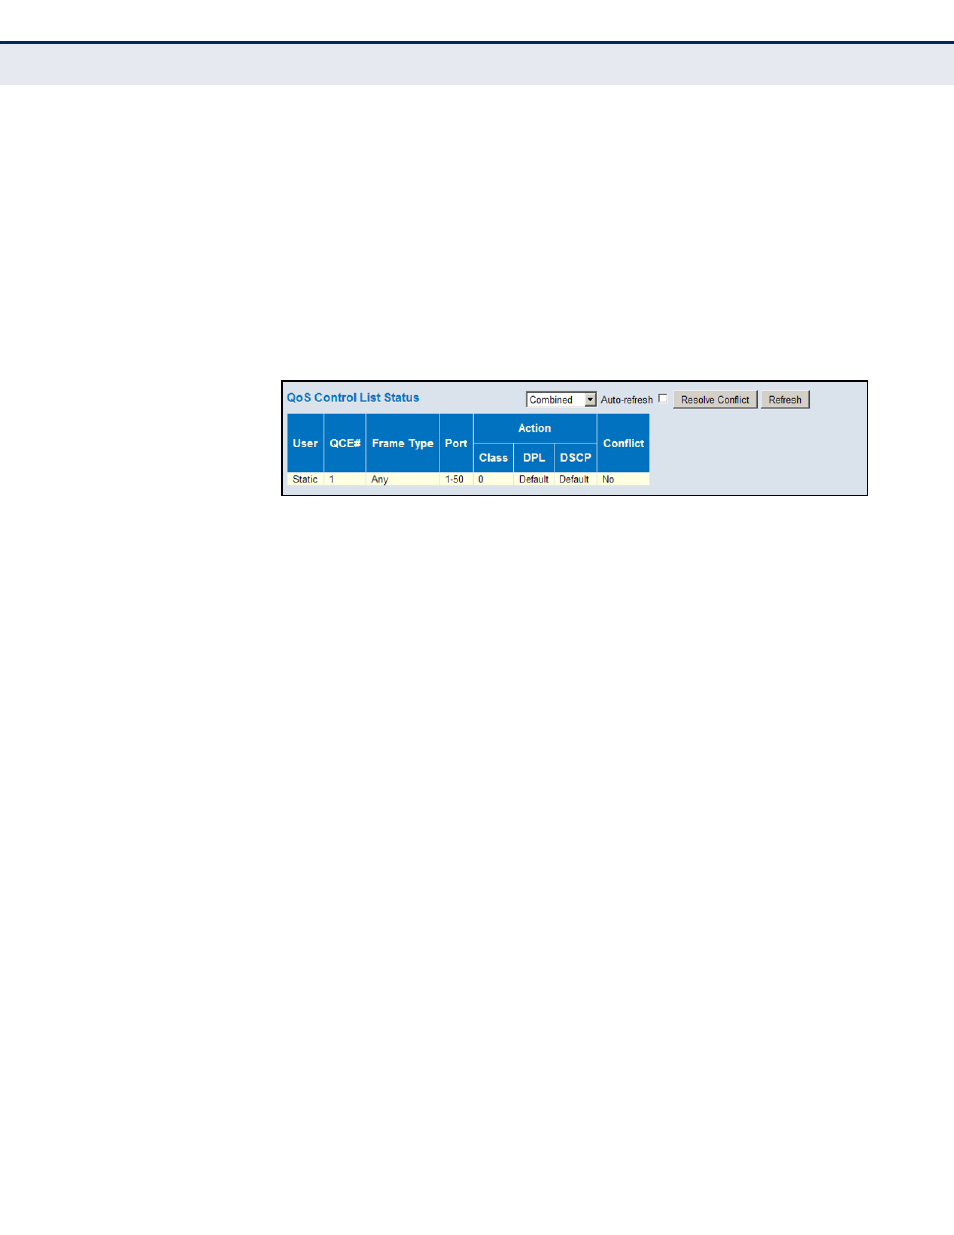
To display the show the status of QCE entries
1.
Click Monitor, Ports, QCL Status.
2.
Select the user type to display from the drop-down list at the top of the
page.
3.
If any of the entries display a conflict, click Resolve Conflict to release
the resource required by a QCE. Then click Refresh to verify that the
conflict has been resolved.
Figure 103: QoS Control List Status
D
ISPLAYING
D
ETAILED
P
ORT
S
TATISTICS
Use the Detailed Port Statistics page to display detailed statistics on
network traffic. This information can be used to identify potential problems
with the switch (such as a faulty port or unusually heavy loading).
All values displayed have been accumulated since the last system reboot,
and are shown as counts per second. Statistics are refreshed every 60
seconds by default.
P
ATH
Monitor, Ports, Detailed Statistics
P
ARAMETERS
These parameters are displayed:
◆
Receive/Transmit Total
■
Packets – The number of received and transmitted packets (good
and bad).
■
Octets – The number of received and transmitted bytes (good and
bad), including Frame Check Sequence, but excluding framing bits.
■
Unicast – The number of received and transmitted unicast packets
(good and bad).
■
Multicast – The number of received and transmitted multicast
packets (good and bad).
■
Broadcast – The number of received and transmitted broadcast
packets (good and bad).
■
Pause – A count of the MAC Control frames received or transmitted
on this port that have an opcode indicating a PAUSE operation.