IAI America RCA2-SD4N User Manual
Page 88
1
1. Life
80
(2) Vertical application
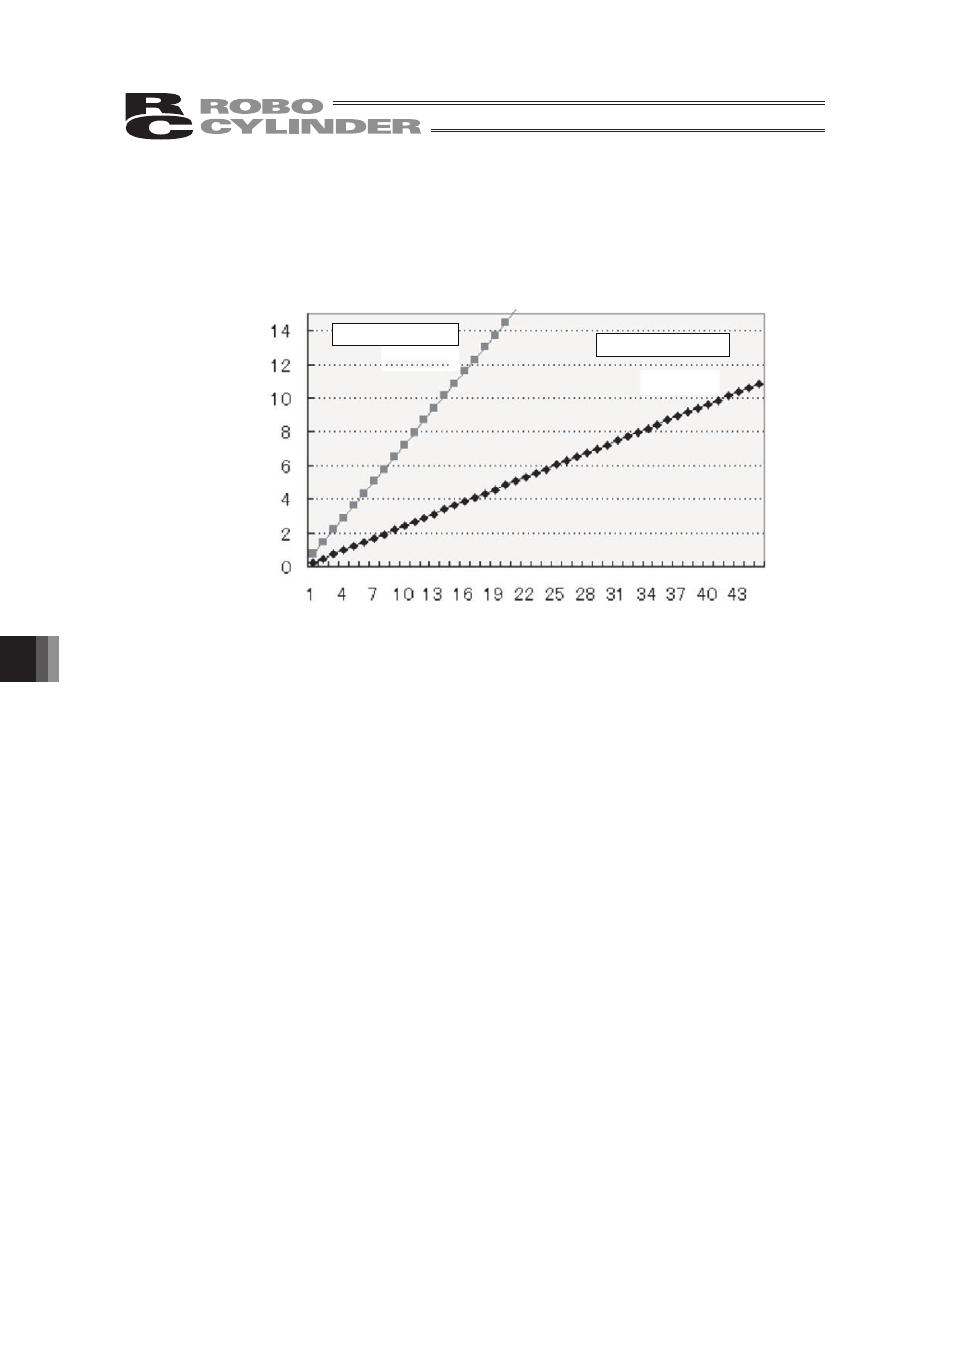
The graph below shows the relationship between the cycle time for one back-and-forth operation
and the life of the product in a vertical application (product life: 5 million back-and-forth operations).
The lines based on 8 hours of operation and 24 hours operations a day, for 240 days a year, are
shown. Use this graph as a reference when determining the product life.
Life (years)
8 hours of operation
24 hours of operation
Cycle time (sec)