Finding the x- and y-difference between two points – PASCO SPARKvue ver.2.0 User Manual
Page 89
7. The x- and y-values of the selected point are displayed.
8. Click the Graph coordinate information button again to clear the selection.
Finding the x- and y-difference between two points
Complete these steps to select a range of points and display the change-in-x and
change-in-y between the first and last points in the selected range:
1. Optional: select a different data run.
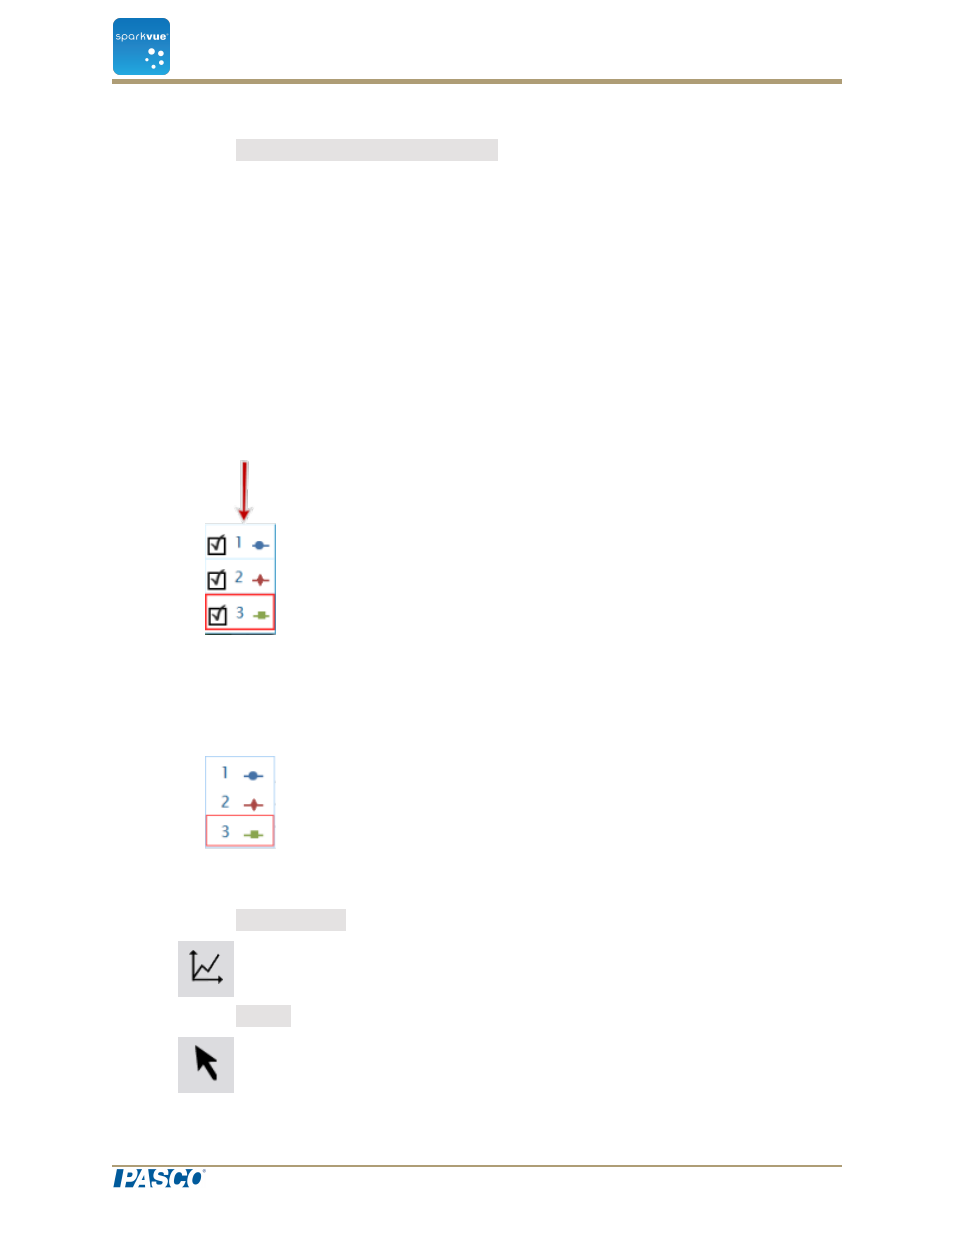
In the display legend, a red outline surrounds the run that is selected for operation.
Complete these steps to change which run is selected:
i. Click the legend.
The legend enlarges.
ii. In the legend, click the symbol (but not the check box) of the run that you
want to select.
The red outline moves to the selected run.
Sample Legend
Note
: When you apply statistics, such as mean or standard deviation, they
are applied to the selected run.
2. Click the Graph Tools button to open the tool palette.
3. Click the Select button.
Document Number: 012-11074D
77
SPARKvue
®
7 Data analysis
Analyzing data in a graph