Annotating data in a line graph, Adding an annotation, Annotating data in a line graph": 30 – PASCO SPARKvue ver.2.0 User Manual
Page 42
Annotating data in a line graph
n
n
"Editing or deleting an annotation": 31
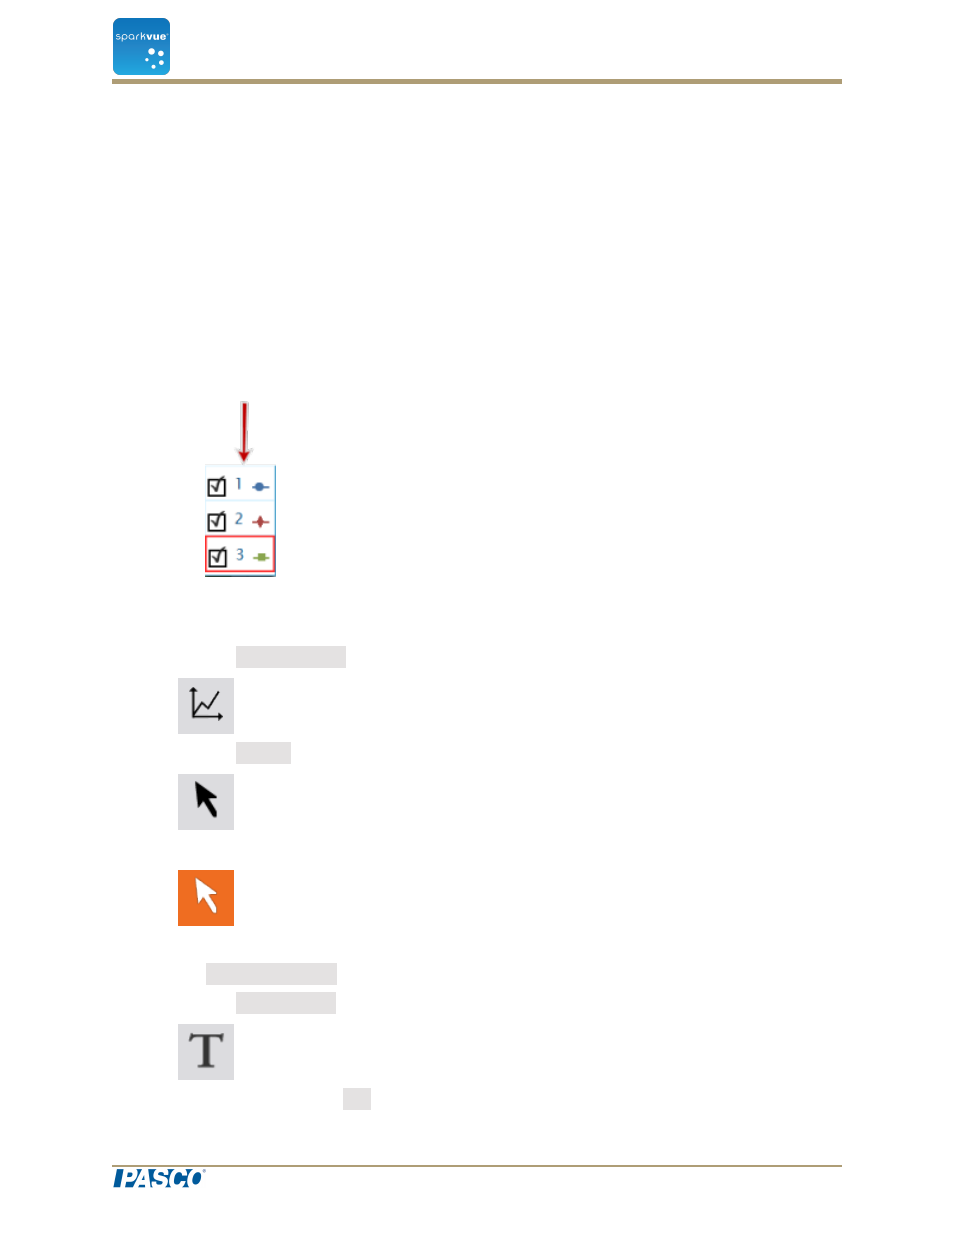
Adding an annotation
1. If there is more than one data run on the line graph, first select the run that the
annotation will be attached to:
a. Click the graph legend.
The legend enlarges.
b. In the legend, click the symbol of the run that you want to select.
The red outline moves to the selected run.
2. Click the Graph Tools button to open the tool palette.
3. Click the Select button.
The button changes color.
4. Click one or points on the graph.
5. Click done selecting.
6. Click the Annotation button.
7. Enter a note and click OK.
Document Number: 012-11074D
30
SPARKvue
®
5 Data display
Displaying data in a line graph