Selecting data for operation in a bar graph, Annotating data in bar graphs, Annotating data in bar graphs": 40 – PASCO SPARKvue ver.2.0 User Manual
Page 52: Selecting data for operation in a bar graph": 40
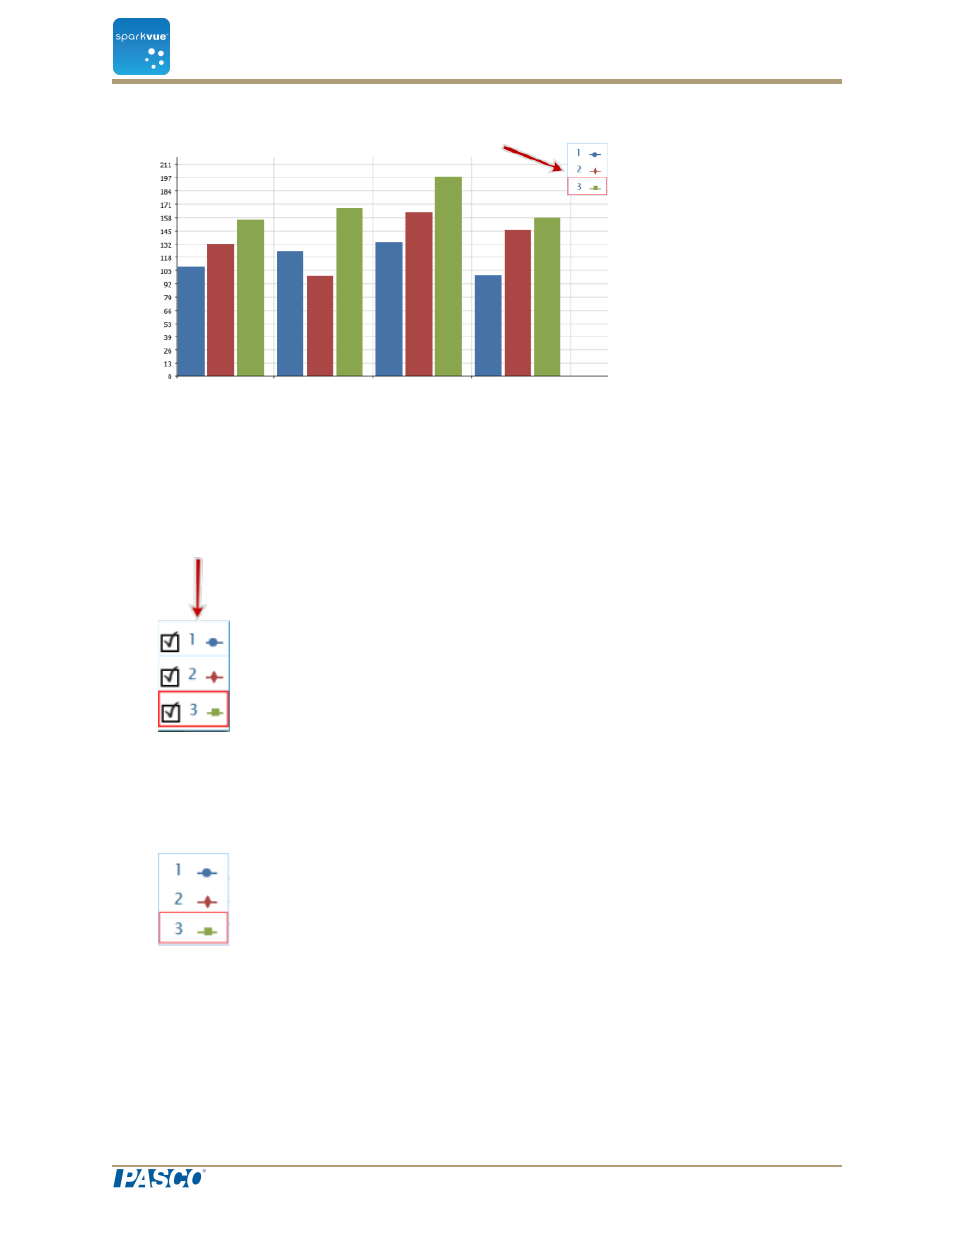
Bar Graph legend
Selecting data for operation in a bar graph
In the display legend, a red outline surrounds the run that is selected for operation. Com-
plete these steps to change which run is selected:
i. Click the legend.
The legend enlarges.
ii. In the legend, click the symbol (but not the check box) of the run that you want to
select.
The red outline moves to the selected run.
Sample Legend
Note
: When you apply statistics, such as mean or standard deviation, they are
applied to the selected run.
Annotating data in bar graphs
You can add annotation and show numeric values on bars.
Document Number: 012-11074D
40
SPARKvue
®
5 Data display
Displaying data in a bar graph