Changing the variable on the x- or y-axis – PASCO SPARKvue ver.2.0 User Manual
Page 39
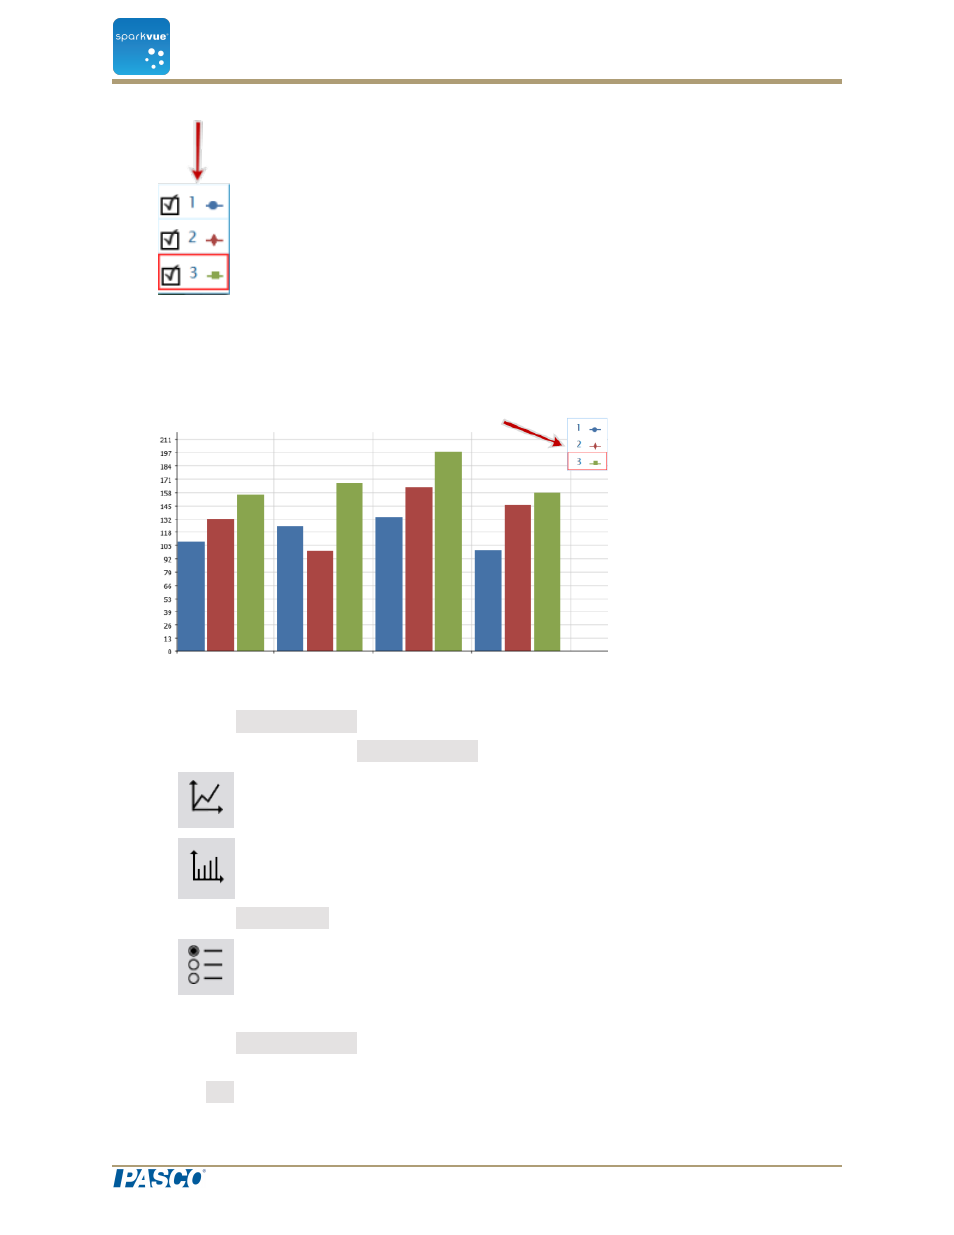
2. Select or clear (Click) the check box next to each data run that you want to show or
hide.
3. Optionally, click outside the legend to reduce the size of the legend.
Graph legend
Changing the variable on the x- or y-axis
1. Click the Measurement button to change; skip to step 4.
2. Or, click the applicable Display Tools button to open the tools palette.
3. Click the Properties button to open the Properties screen.
4. Click the display variable you want to change.
5. Click the Measurement box and click the replacement measurement or other vari-
able.
6. Click OK.
Document Number: 012-11074D
27
SPARKvue
®
5 Data display
Displaying data in a line graph