YSI 600DW-B Sonde User Manual
Page 65
Sondes
Section
2
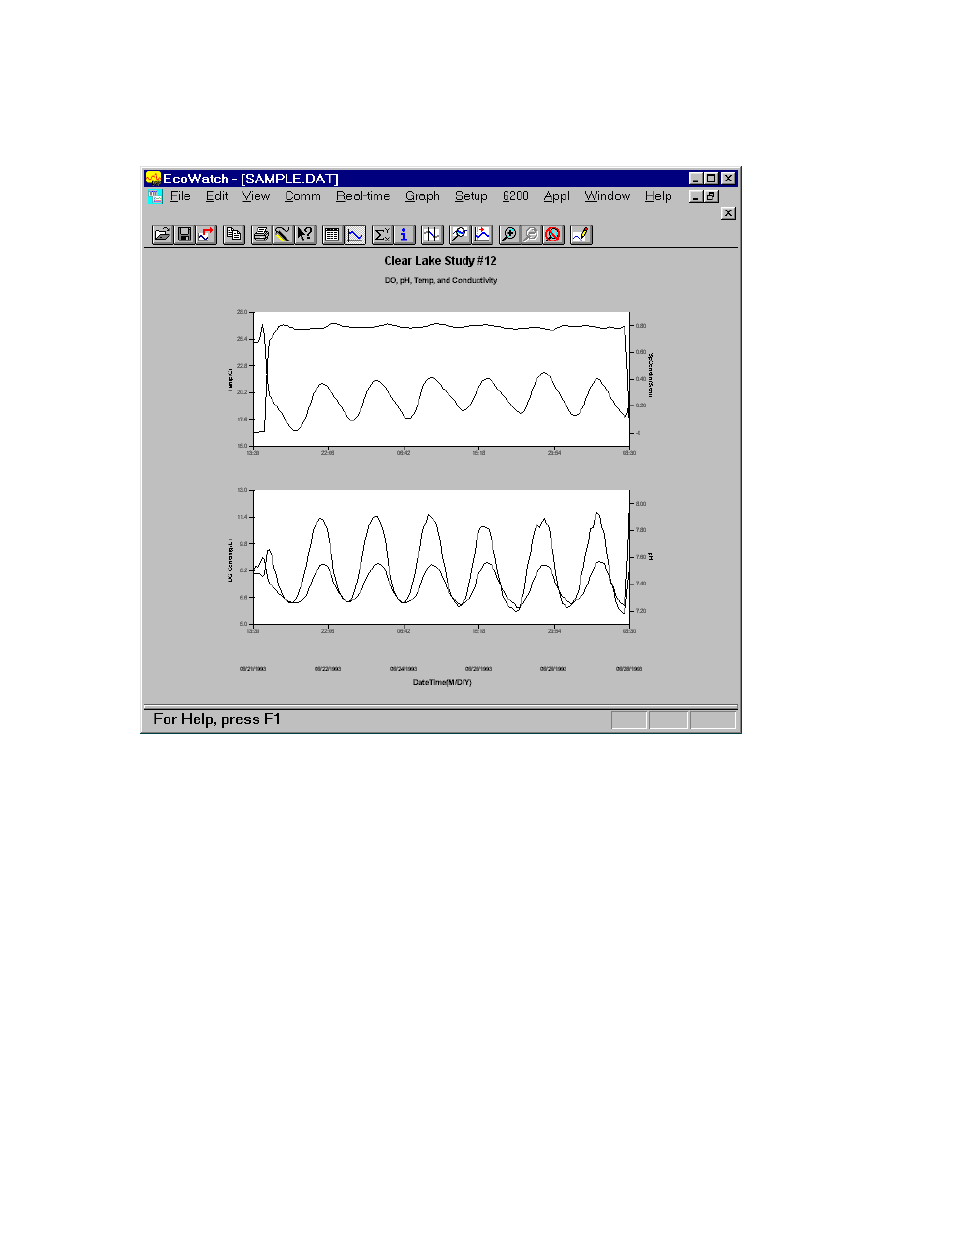
Customizing a Graph from SAMPLE.DAT
Finally, we selected
File|Save Data Display and gave the custom plot the name “4PARAM” to that the
presentation can be immediately recalled in the future.
As you become more familiar with EcoWatch for Windows, the plotting, analysis and reporting functions
can be accomplished easily and quickly. Practice with all of the functions and, again, do not forget to use
Window’s Help for more detail, or see Section 4,
EcoWatch for Windows.
YSI Incorporated
Drinking Water Monitoring Systems Operations Manual
2-58
This manual is related to the following products: