Digit year, Graph, Table – YSI 600DW-B Sonde User Manual
Page 194: Grid, Markers, Statistic
EcoWatch for Windows
Section 4
4-DIGIT YEAR
Use this command to toggle between a date with a two or four digit year on the graph and table.
GRAPH
Use this command to display and hide the Graph page when viewing a file. The graph page
contains plots of data.
Shortcuts
Toolbar:
TABLE
Use this command to display and hide the Table page while viewing a data file.
Shortcuts
Toolbar:
GRID
Turns on or off the gridlines on graphs.
MARKERS
Turns on or off data point markers on the graphs. For graphs with more than a few data points we
recommend that Markers be left off.
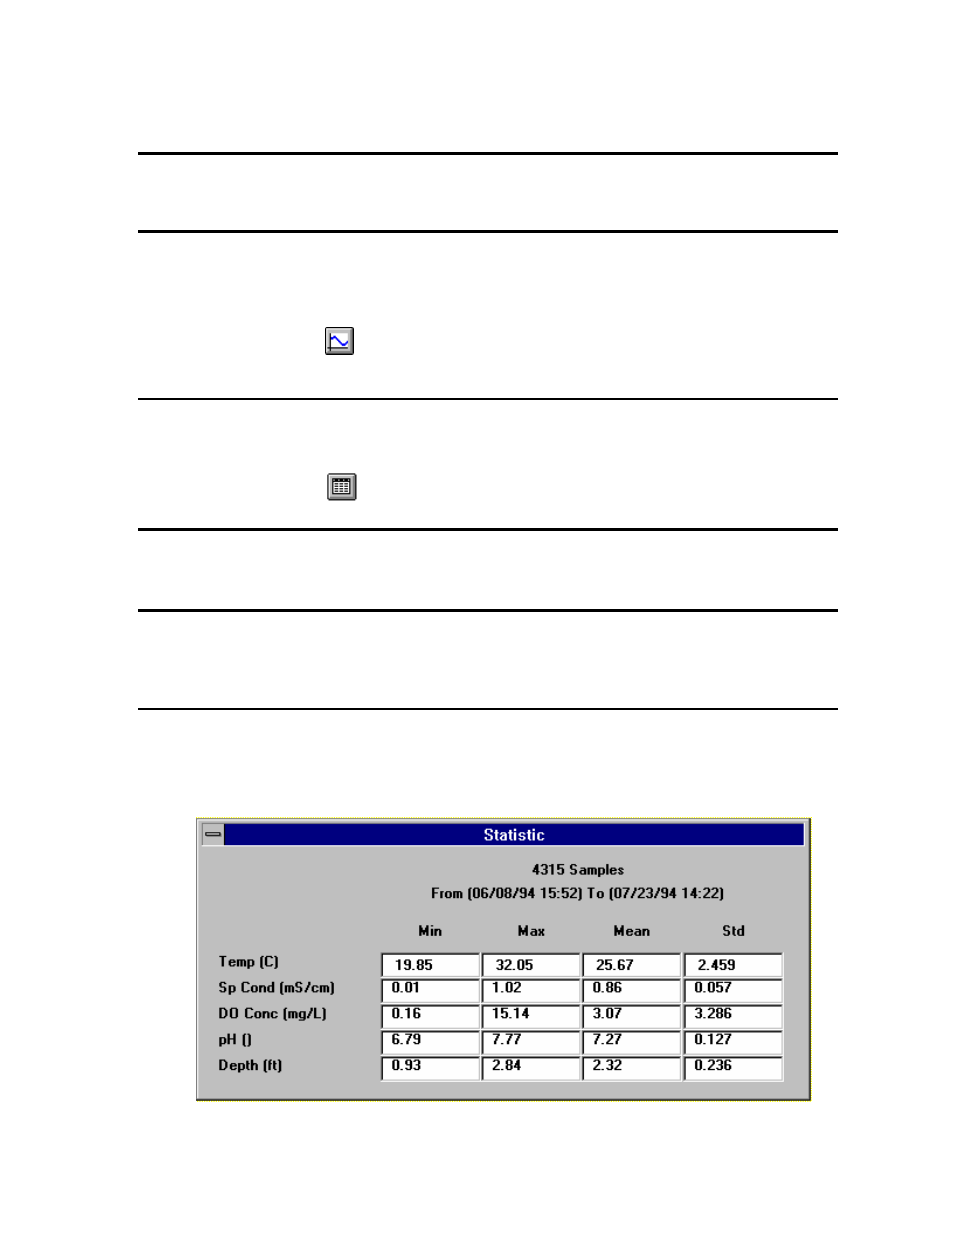
STATISTIC
This command will display statistics for the current study. It will show the minimum, maximum, mean,
and standard deviation for each of the current parameters. If you click on any minimum or maximum
value, then a small box will appear showing the date and time when the minimum or maximum point
occurred.
YSI Incorporated
Drinking Water Monitoring Systems Operation Manual
4-23