YSI 600DW-B Sonde User Manual
Page 59
Sondes
Section
2
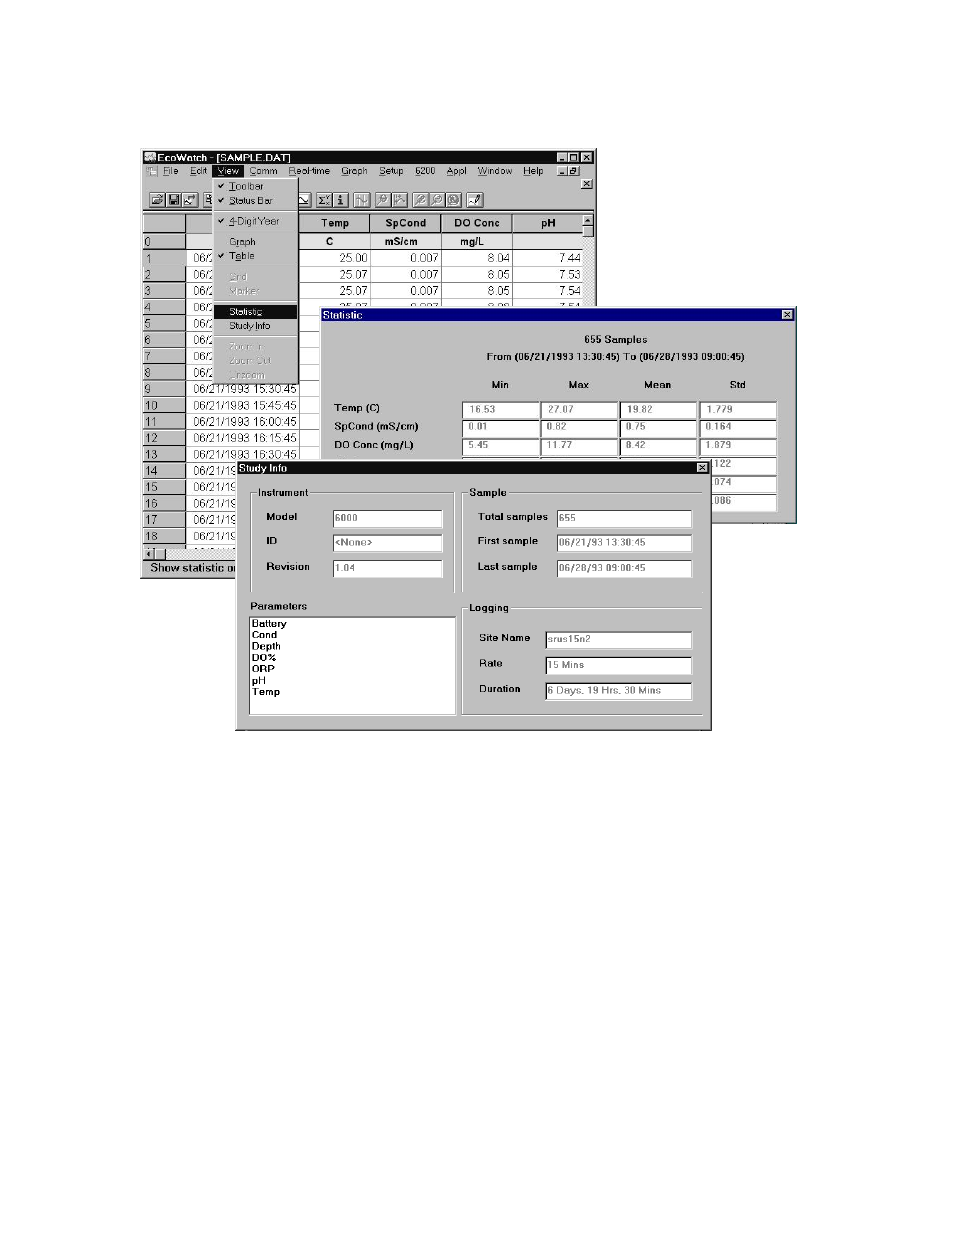
Statistics and Study Information
Next, with the Statistics and Study windows closed, return to the
View menu, close Table and activate
Graph.
Using the right mouse button, click at any point on the graph. A dotted vertical line appears along with
specific data values in boxes to the left of the displayed graphs, as shown in the figure below. You can
hold down the right mouse button and move the mouse to scan the entire graph that is displayed in the
window. The values in the boxes change as you move the mouse. This feature is very useful for
quantifying specific data without the need to open the data table and scroll through what may be thousands
of data points. Note also that the exact time and date change to let you know specifically when an event of
interest occurred.
YSI Incorporated
Drinking Water Monitoring Systems Operations Manual
2-52