Texas Instruments MSP50C614 User Manual
Page 319

Software Emulator
5-19
Code Development Tools
being run in emulation mode. STK field is the depth of the stack. The emulator
keeps track of number of calls and returns and changes this variable
accordingly. CUR field is the current subroutine name. In C–– programs it
becomes very handy to display local variables of a subroutine. C– –
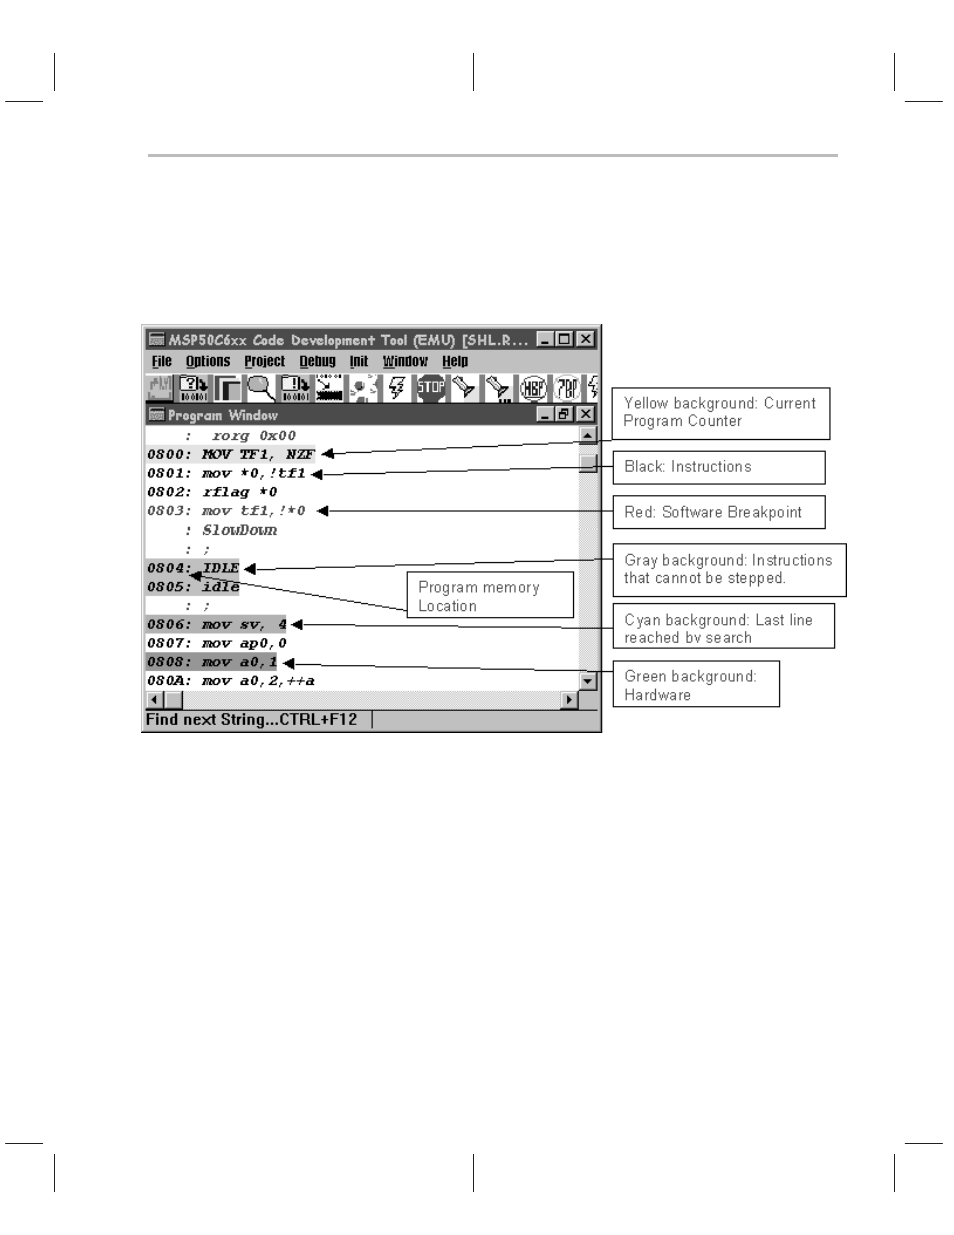
Figure 5–19. Program Window
Program Window : The program window displays program instructions,
comments, preprocessor text, and program memory location. The project
must be built (or made) to view the instructions on the program window. If the
program is not properly built, the emulator displays error message and
launches the PFE.EXE editor to correct the error. The programmer should fix
the errors, save the new file, and try to rebuild again.
The text in program window is displayed in a different color. Instructions are
displayed as black text. Comments are always displayed as green text.
Preprocessor text is displayed as comments. The current instruction pointed
by program counter is displayed as text with yellow background. This highlight
forwards as you step through the code. Lines containing software breakpoints
are displayed in red. To set a software breakpoint, just click the right mouse
button over the line you want to break. Only program lines that are not in a
gray
area can contain breakpoints. To remove a breakpoint, click the right mouse
button over the line containing the breakpoint to be removed. Texts with cyan
