Fortinet FortiGuard Analysis 1.2.0 User Manual
Page 32

FortiGuard Analysis and Management Service Version 1.2.0 Administration Guide
32
13-12000-406-20081031
Configuring widgets
Dashboard
•
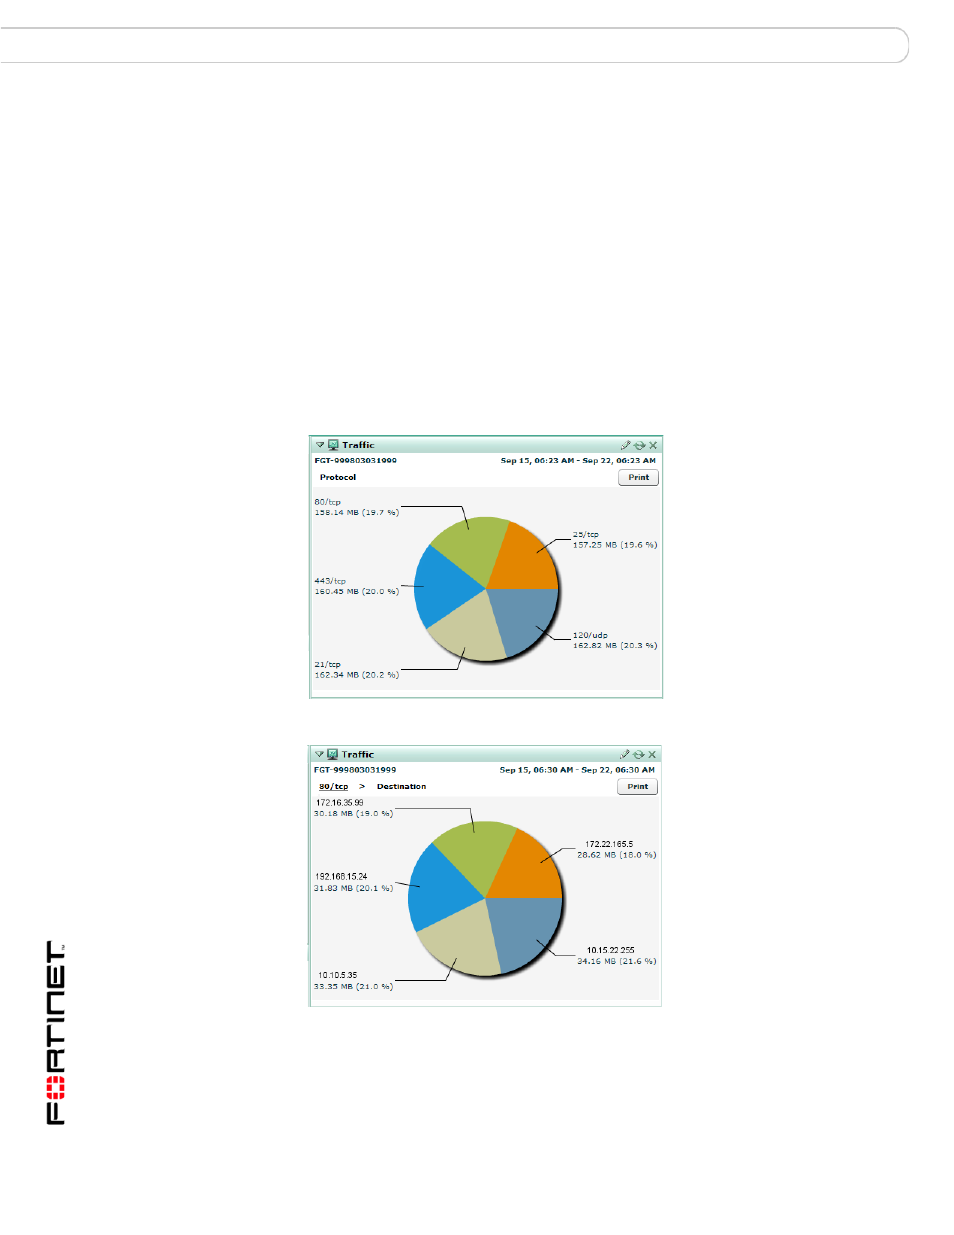
Figure 16: Traffic Report pie chart displaying the top traffic level by protocol
Figure 17: Traffic Report pie chart displaying second-level information for 80/tcp
To date
The end date and time of the time range. Appears
only when Specify is selected in Report period.
Select the calendar to configure the end date and
time. Select OK after configuring both the date
and time.
Top
Enter the top number of entries to be displayed. For example, select
10 from the list so that only the top 10 events display.
Color (Bar chart
only)
Select the color of the bars on the bar chart. This is available only
when bar chart is selected. You can select a color from either the list
or the color block.
When you select the color block, the Color Palette appears; select a
color and then select OK to apply it to the variable.
OK
Select to save the settings (current session only).
Note: You must select Customize > Save Settings from the
Dashboard if you want your settings to be saved permanently.
