Fortinet FortiGuard Analysis 1.2.0 User Manual
Page 13

Setup
About the portal web site
FortiGuard Analysis and Management Service Version 1.2.0 Administration Guide
13-12000-406-20081031
13
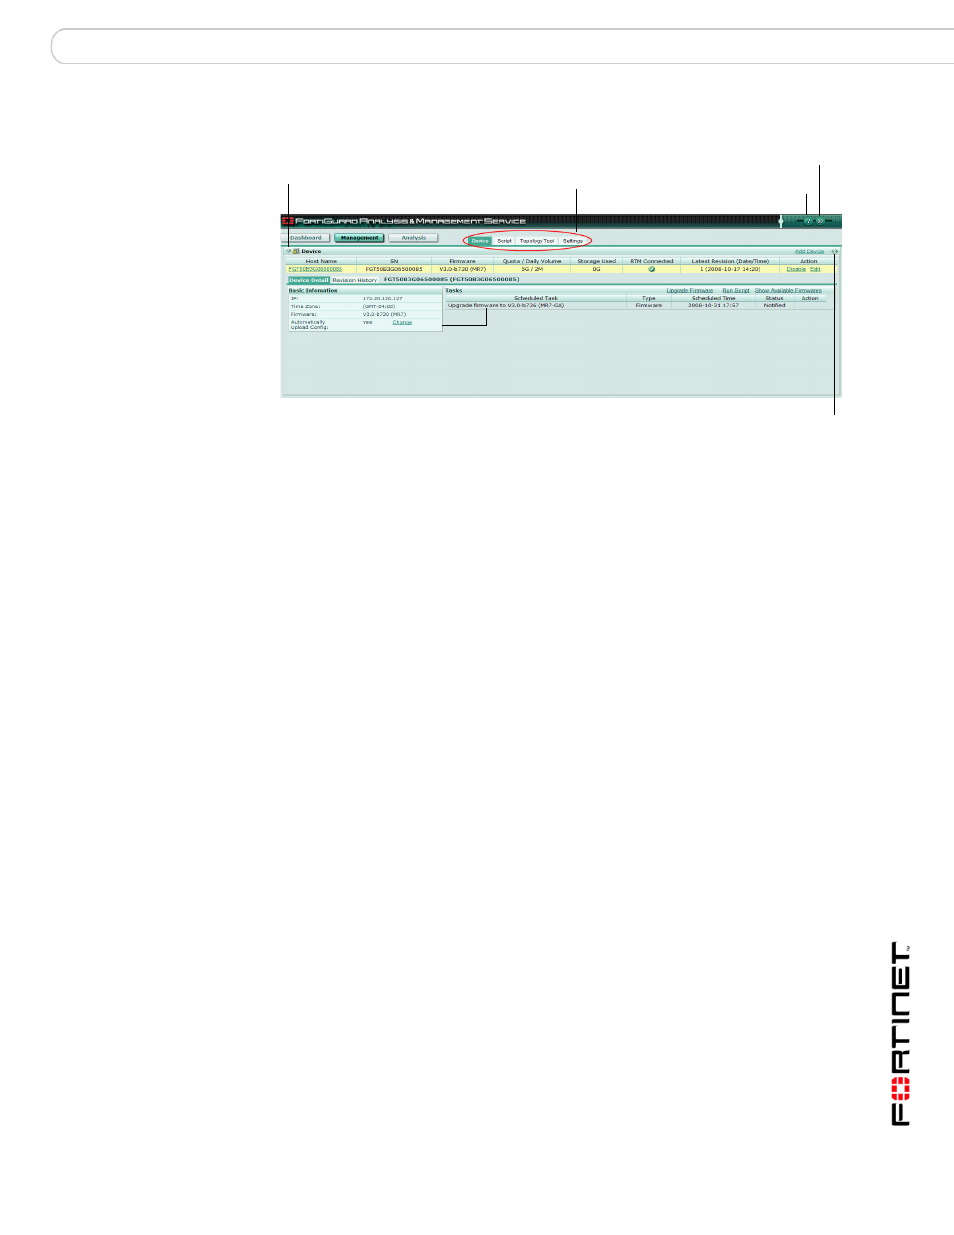
Figure 2: Portal web site layout, Management view
Dashboard main
menu
The Dashboard main menu provides all features that are related to it,
such as customizing and adding pages. You can add widgets to the
pages as well.
Dashboard
The Dashboard tab allows you to configure the
widgets and their layout. You can also make the
Dashboard tab the default page.
Customize
The Customize link allows you to configure a new
page.
New page
The New page link allows you to add a new page to
the Dashboard menu.
Management
main menu
The Management main menu provides remote management features,
such as settings and device information.
Device
The Device tab provides information about the
devices, such as connection status to the service,
tasks, and revision history. You can also schedule
upgrades for devices and run scripts.
Script
The Script tab allows you to upload, input and
manage scripts.
Topology Tool
The Topology Tool tab allows you to configure a
network diagram of your network.
Settings
The Settings tab provides account and user
information, and allows you to configure alert profiles.
Analysis main
menu
The Analysis main menu provides logging and reporting features.
Log Viewer
The Log Viewer tab allows you to view recent logs
that are received in real-time, as well as historical log
files that are stored on the FortiGuard Analysis
server.
Log File Browser The Log File Browser tab allows you to browse
through historical log files.
Report
The Report tab provides access to all reports.
e-Discovery
The e-Discovery tab allows you to perform advanced
searches of email messages.
Tabs
Help
Logout
Sections
Expand Arrow
Refresh
