Fortinet FortiGuard Analysis 1.2.0 User Manual
Page 31

Dashboard
Configuring widgets
FortiGuard Analysis and Management Service Version 1.2.0 Administration Guide
13-12000-406-20081031
31
• Event Report – provides information about event activity that is based on event
logs, such as an administrator logging in to that device’s web-based manager.
• Virus Report – provides specific information about each real or suspected virus
that the device detects; selecting the name of a virus redirects you to the
FortiGuard Center Virus Encyclopedia for additional information
• IPS Report – provides information about IPS anomalies and signatures
• Web Report – provides information about Internet activity and visited web sites
• Spam Report – provides information about spam activity
• Report Browser – displays all reports that are generated; this widget displays
the same information as in Analysis > Report, and does not need to be
configured.
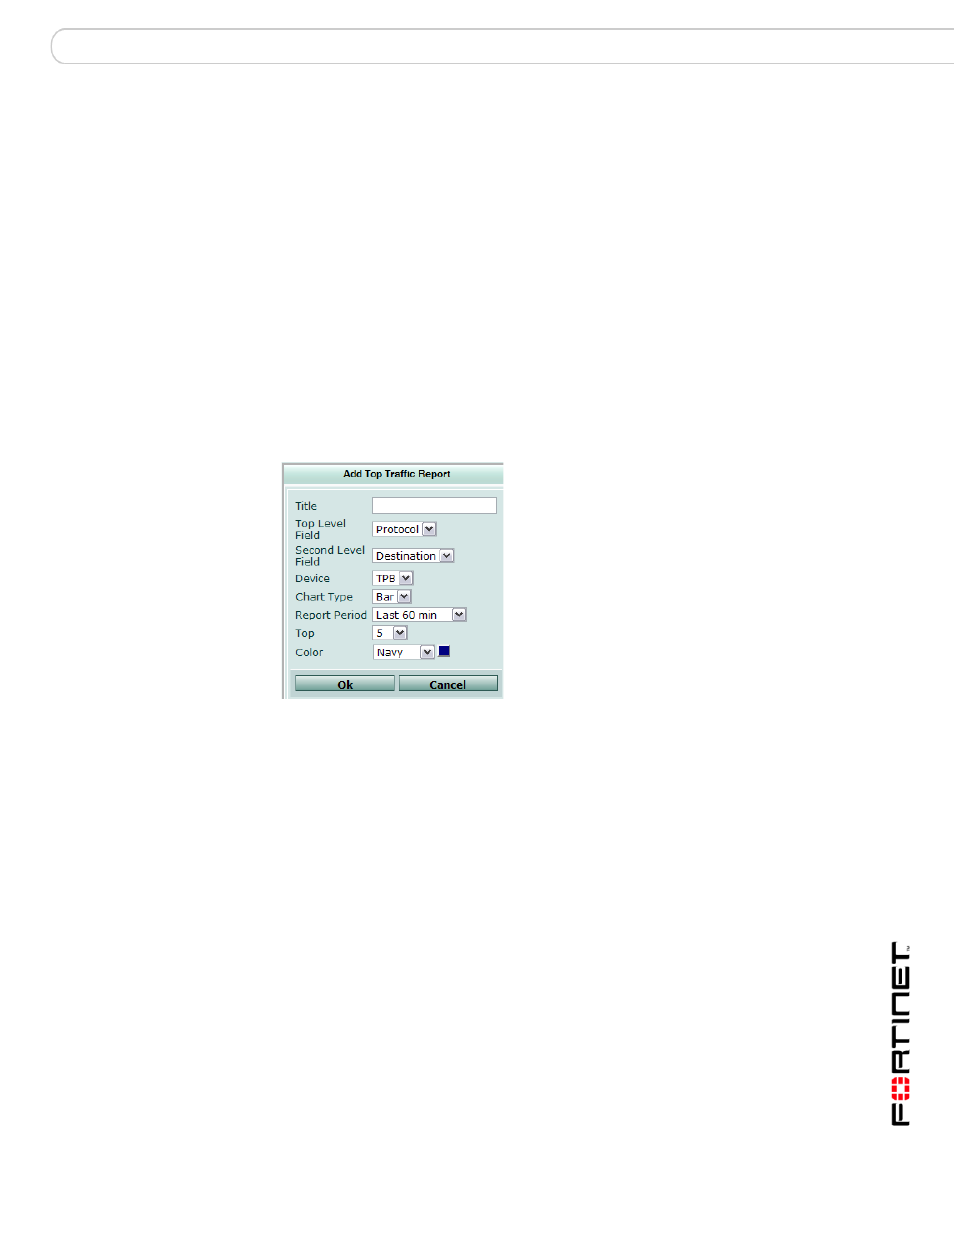
To configure a report widget, select the report widget in Add Widgets, follow the
instructions in the table below, and select OK. If you want to edit an existing report
widget, select the Edit icon in the widget and then follow the instructions in the
table below. Select OK to save the changed settings.
Figure 15: Report configuration screen (Traffic Report displayed)
Title
Enter the name of the report. For example, Headquarters_Traffic
indicates the type of report and specific context.
Top Level Field
Enter the level of information that appears first. For example, you
would select Source from the Top Level list in a Traffic Report to
have the source IP addresses display first.
Second Level Field Enter the level of information that gives details about the top level
information.
You can access this information by selecting the top level information
(for example, a bar in the bar chart).
Device
Select the device from which to gather the information.
Chart Type
Select the type of chart used for displaying the information, either a
bar chart (default) or a pie chart.
Report period
Select the period of time when these activities or events happened.
For example, select 24 hours to display the last 24 hours of network
traffic.
If you want to specify a time range, select Specify from the list. The
options From date and To date appear.
From date
The start date and time of the time range. Appears
only when Specify is selected in Report period.
Select the calendar to configure a start date and
time. Select OK after configuring both the date
and time.
