Viewing interface detail, Viewing interface detail -25 – Enterasys Networks 700 User Manual
Page 45

Viewing Device Information
2-25
The MultiSwitch 700 Device View
Viewing Interface Detail
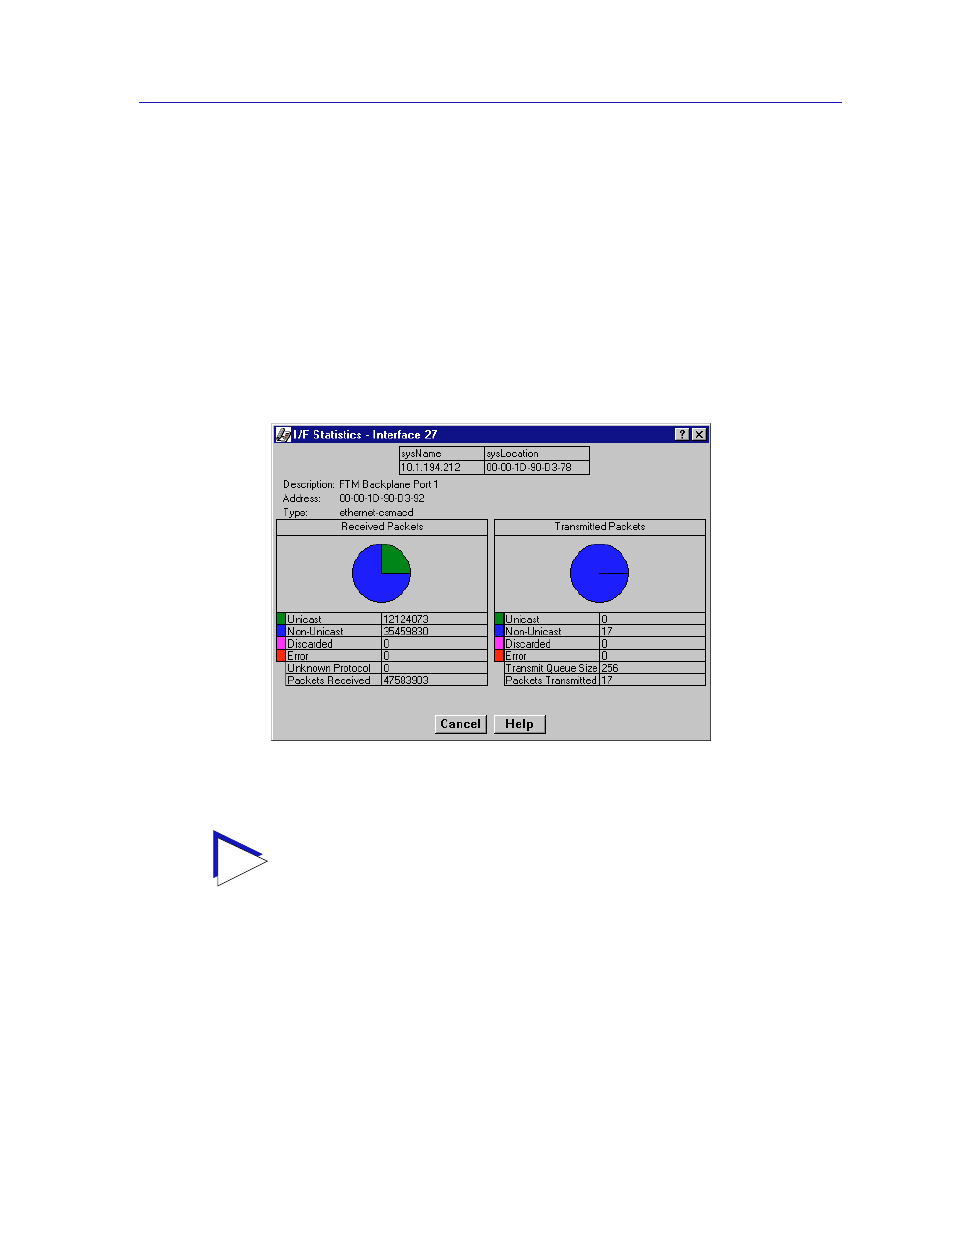
The Interface Statistics window (
Figure 2-13
) provides detailed MIB-II interface
statistical information — including counts for both transmit and receive packets,
and error and buffering information — for each individual port interface.
Color-coded pie charts also let you graphically view statistics for both received
and transmitted Unicast, Multicast, Discarded, and Error packets.
To open the Interface Statistics window:
1.
In the I/F Summary window, click to select the interface for which you’d like to
view more detailed statistics.
2.
Click on Detail. The appropriate I/F Statistics window,
, opens.
Figure 2-13. Detail Interface Statistics
Three informational fields appear in the upper portion of the window:
Description
Displays the interface description for the currently selected interface (e.g., Enet
Port, Fast Enet Port, FDDI, ATM, or Backplane Port).
Address
Displays the MAC (physical) address of the selected interface.
TIP
You can also access this information via the I/F Statistics option available on the
individual port menus; see Chapter 3,
, for more information.
