Ch 2 - tour of daqview, A brief look at the main window, Tour of daqview 2 – Measurement Computing DaqView User Manual
Page 9
DaqView & ViewXL
User’s Guide
987791
A Tour of DaqView 2-1
Tour of DaqView
2
A Brief
Look at the Main Window….. 2-1
Functionality Differences Amongst Devices
……2-3
A DaqView Walk-
Through …… 2-5
From Opening DaqView to DBK Setup
…… 2-5
Channel Readings, Acquire, and Post-
Acquisition Buttons …… 2-8
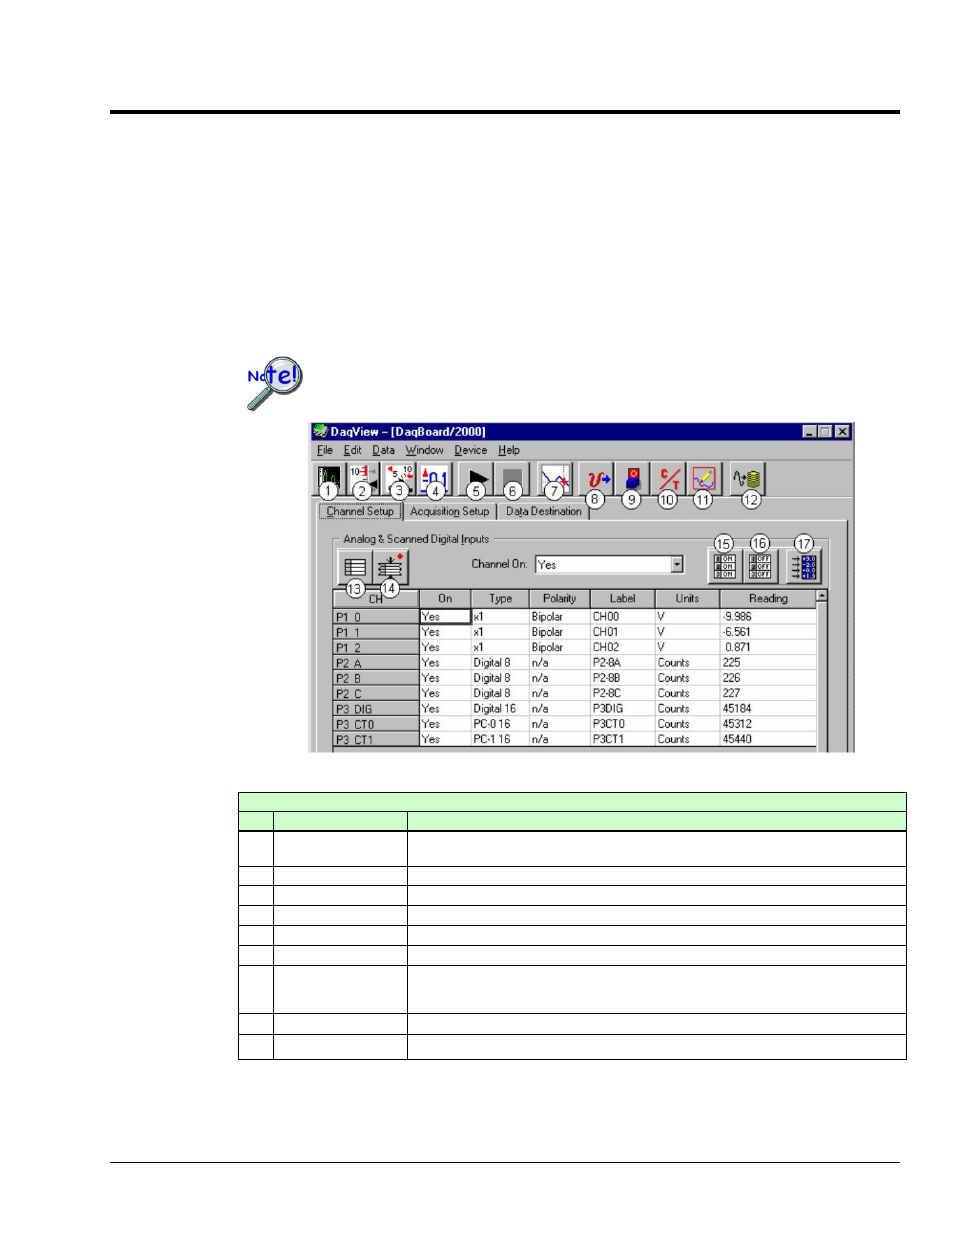
A Brief Look at the Main Window
Daq devices differ from one another in regard to functionality. Functions that are
not supported by a particular board [or device] will be grayed-out or hidden.
DaqView Main Window
(See Note 1)
Channel Setup Tab Selected
Main Window, a Brief Description of Button Control Functions
#
Item
Description
1
Scope
Brings up a window from which Scope and/or Chart displays can be configured and
used for analyzing data in relation to x and y axes.
2
Bar Graph Meters
Displays a bar graph meter.
3
Analog Meters
Displays an analog dial meter.
4
Digital Meters
Displays a digital meter.
5
Start All Indicators
Starts displaying data in the Reading column and any open Chart or Meters window.
6
Stop All Indicators
Stops displaying data in the Reading column and any open Chart or Meters window.
7
View File Data
Launches an independent post-data acquisition program, such as
eZ-PostView, if installed. The data acquisition CD includes a PDF version of the post
data acquisition document.
8
Analog Output
Displays the Analog Output window of the available DAC channels.
9
Digital I/O
Displays the Digital I/O window.
Note 1: Although the GUI (graphical user interface) shown above is from a DaqBoard/2000 application, it can be used
to understand the GUI functionality for other device applications.