Ch 6 - meters, Bar graph meters, Meters 6 – Measurement Computing DaqView User Manual
Page 47
Meters
6
Overview …… 6-1
Bar Graph Meters …… 6-1
Analog Meters …… 6-2
Digital Meters …… 6-3
Properties of Meters Windows …… 6-4
Scope updates take precedence over all other display
modes. Heavy scope activity pertaining to very fast
data acquisition, large data acquisition, high
averaging, and auto-rearm is likely to degrade the
performance of meters and the spreadsheet
“readings” display.
Overview
DaqView includes a set of three meters for the convenience of viewing data in Bar Graph, Analog,
and/or Digital format. The three meter types can be displayed individually or simultaneously.
Each meter includes a user-friendly toolbar comprised of the following buttons, with exception of the
Digital Meter, which has no
Start Stop Reset Stay-On- Print Rows x Columns
Peak Top
Hold*
Meters Toolbar Buttons*
*
Reset Peak Hold does not apply to Digital Meters.
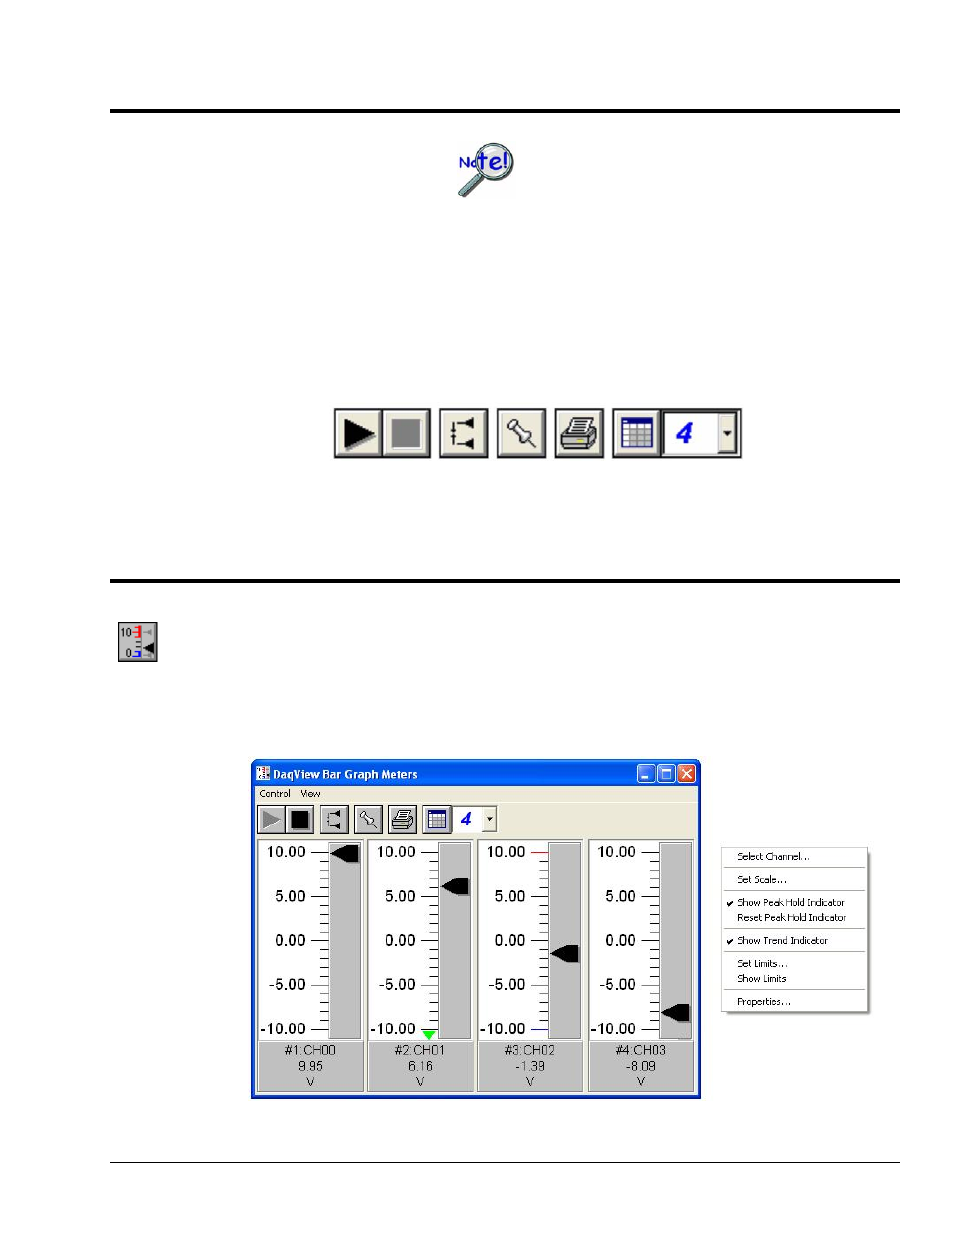
Bar Graph Meters
Selecting the Bar Graph Meter icon brings up the Bar Graph window to display several channels in bar
graph format. To activate the display, select the
Indicators in the pull-down menu or in the toolbar). You can vary the number of channels displayed by
selecting the input box at the end of the toolbar. The Grid tool (next to last item on toolbar) is used to
arrange the display for convenient reading. The pushpin icon in the center of the toolbar locks this window
on top of other windows until you unlock it by selecting the pushpin again. Right-click on a meter to bring
up an option menu.
Bar Graph Meters for 4 Channels, Options Menu Shown at Right
DaqView User’s Guide
899694
Meters 6-1