Measurement Computing DaqView User Manual
Page 39
DaqView User’s Guide
877893
The Scope Window 5-3
8
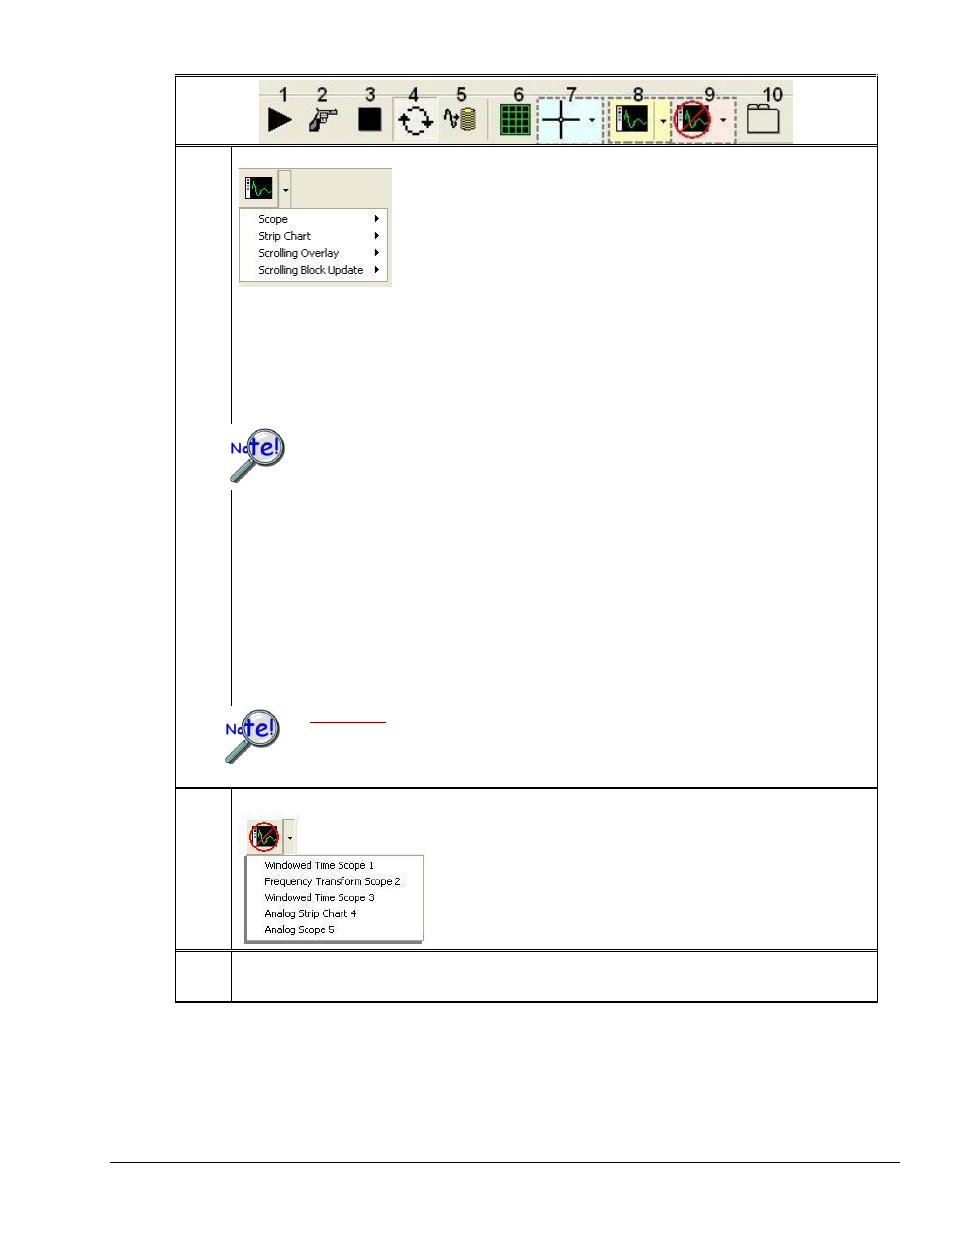
Add Display
Clicking the button adds an Analog Scope in Raw Time mode. Clicking the
adjacent down-arrow displays a pull-down list of 4 display options, as indicated in
the figure. Moving the cursor over an option highlights the selection and displays
additional options. These are presented below.
Scope
– Allows the user to select to add an Analog, Counts, or Logic Scope Display. When “analog” is
selected the user has a choice of adding a scope which exhibits one of the following functions:
○
Raw Time
○
Filter
○
Averaged Time
○
Windowed Time
○
Decimated Time
○
Frequency Transform
○
RMS Time
○
Spectrum Analysis
To display meaningful data, the Spectrum Analysis mode
requires a minimum of three complete waveform cycles.
Display charts are intended for viewing general data trends and employ a decimation process
to facilitate continuous scrolling. Because of the decimation process it is common for Charts
and Scopes to present a different rendering of the same signal. The Scope display will always
be the more accurate of the two renderings since it represents all data points.
Strip Chart
– Allows the user to add an Analog, Counter, or Logic Strip Chart.
See following Auto Re-arm note
.
Scrolling Overlay
– Allows the user to add an Analog or Counter scrolling overlay display. When this option is
selected, once data is displayed at the rightmost edge of the x-axis the display continues at the left edge of the
display; here it begins to [and continues to] overwrite the previously displayed data. A small display gap leads
the new data to visually separate it from the data image being overwritten.
See following Auto Re-arm note
.
Scrolling Block Update
– Allows the user to add an Analog or Counter block update display. When this
option is selected, once data is displayed at the rightmost edge of the x-axis the completed display is
discarded. This occurs at the same instant the display begins again at the minimum point on the x-axis (the
leftmost edge of the display).
See following Auto Re-arm note
.
Auto Re-Arm
:
Strip Charts, Scrolling Overlays, and Scrolling Block Updates will likely fail to
display the last block of data when auto rearm is used. This is because the automatic restart
of scrolling begins before the last data has had time to display. If this is undesirable you can
either (a) manually restart acquisitions instead of using auto rearm, or (b) use auto rearm, but
compensate for the restart/display aspect by acquiring an extra block of data.
9
Delete Scope Display
Clicking the button deletes the selected display. If no display is selected,
then the last display to have been added [to that display page] will be
deleted.
Clicking the adjacent down-arrow lists all displays for the current display
page (see figure). Clicking on one of the listed displays deletes it.
10
Add Display Page
Adds a blank page and labels it via an associated tab, e.g., Display Page 2,
Display Page 3, etc. Use the add display button (#8) to populate the page with
displays.