Display-dedicated toolbars – Measurement Computing DaqView User Manual
Page 40
5-4 The Scope Window
877893
DaqView User’s Guide
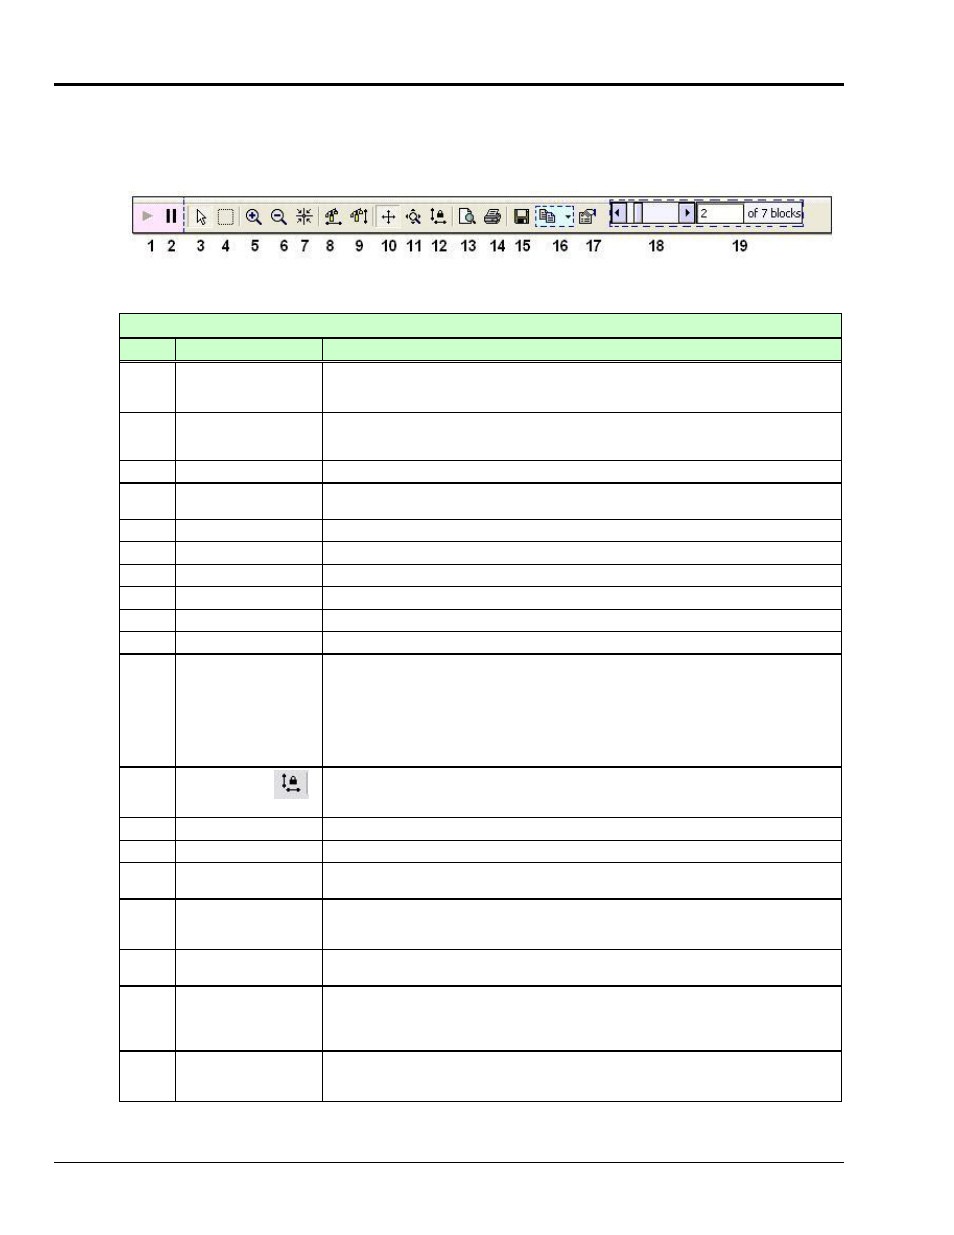
Display-Dedicated Toolbars
A secondary, display-dedicated toolbar is located at the top of each Scope Display. Note the resume and pause
buttons (1 and 2 respectively) are only visible for strip-chart and scrolling displays. These two buttons do not apply
to scope display modes.
Display-Dedicated Toolbar*
* Depending on mode and display type, certain toolbar items will not be visible at all times.
Display Toolbar Items
Item #
Item
Description
1
Resume
(Strip Chart and
Scrolling Modes Only)
Resumes a display which has been paused. The resume button applies to strip charts
and scrolling displays. It does not apply to scope mode and will not be visible for scope
mode displays.
2
Pause
(Strip Chart and
Scrolling Modes Only)
Used to pause a strip chart or a scrolling display. It does not apply to scope mode and will
not be visible for scope mode displays.
3
Select
Used to select and reposition cursors.
4
Zoom-Box
The Zoom-Box function allows you to draw a box around an area that you desire to zoom-
in on. This results in new x and y coordinates for the scope display.
5
Zoom-In
Each click of the plus-magnifier image results in a zoom-in.
6
Zoom-Out
Each click of the minus-magnifier image results in a zoom-out.
7
Zoom-In on Cursor
Zooms in to the area around the cursor.
8
Auto-Scale X-Axis
Automatically adjusts the X-axis.
9
Auto-Scale Y-Axis
Automatically adjusts the Y-axis.
10
Axis Scroll
Allows simultaneous scrolling of both axes.
11
Axes Zoom
After clicking “Axes Zoom” you can click in one of three areas of a scope display to zoom
in or out on the: y-axis, x-axis, or both (when you click within the display region, instead of
x or y specifically).
x-
axis: click and drag “right” to zoom-out; “left” to zoom-in.
y-
axis: click and drag “up” to zoom-out; “down” to zoom-in.
x-axis and y-axis simultaneously: right and/or up to zoom-out; left and/or down to zoom-in.
12
Lock Axes
(Scope
Mode Only)
When pushed-in, the lock axes function overrides auto and manual scaling. This
maintains (locks-in place) the current X and Y-axis when new acquisitions begin.
When Lock Axes is inactive, auto and manual-scaling function normally.
13
Print Preview
Opens a Print Preview window which allows you to view and print the display.
14
Prints the display.
15
Save Plot as
A Windows-type save feature in regard to where to save, naming the file, and selecting the
file type (.bmp, .gif., .jpg. .dat, etc.)
16
Copy to Clipboard
Allows you to “Copy Picture” or “Copy Data” to the clipboard. The selection is made via
the small pull-down arrow just right of the button. The clipboard item can be pasted into
a document such as Microsoft Word.
17
Edit Display
Accesses the Options Dialog Box for changing display preferences. (See pgs. 5-4 and 5-
5)
18
Upper Scroll Bar
***
This scroll bar is only visible when using Filter, Spectrum, Frequency Transform or
Windowing charts. It is used to display a data block. Block sizes are defined in the
scope’s display Options dialog box in the Scans per Block field. (More information
appears in the following text segment).
19
Block Identifier
***
The block identifier is directly associated with the upper scroll bar and is only visible when
using Filter, Spectrum, Frequency Transform or Windowing charts. It identifies the current
block being displayed.
*** Upper Scroll Bar and Block Identifier only appear for Filter, Spectrum, Frequency Transform, and Windowing charts.