Viewing the profile elevation graphs – DeLorme 6 User Manual
Page 308
XMap User Guide
300
4. Select a linear object or route on the map to generate its profile. When you
select the object, it is highlighted and the Profile graph displays in the Profile
tab area.
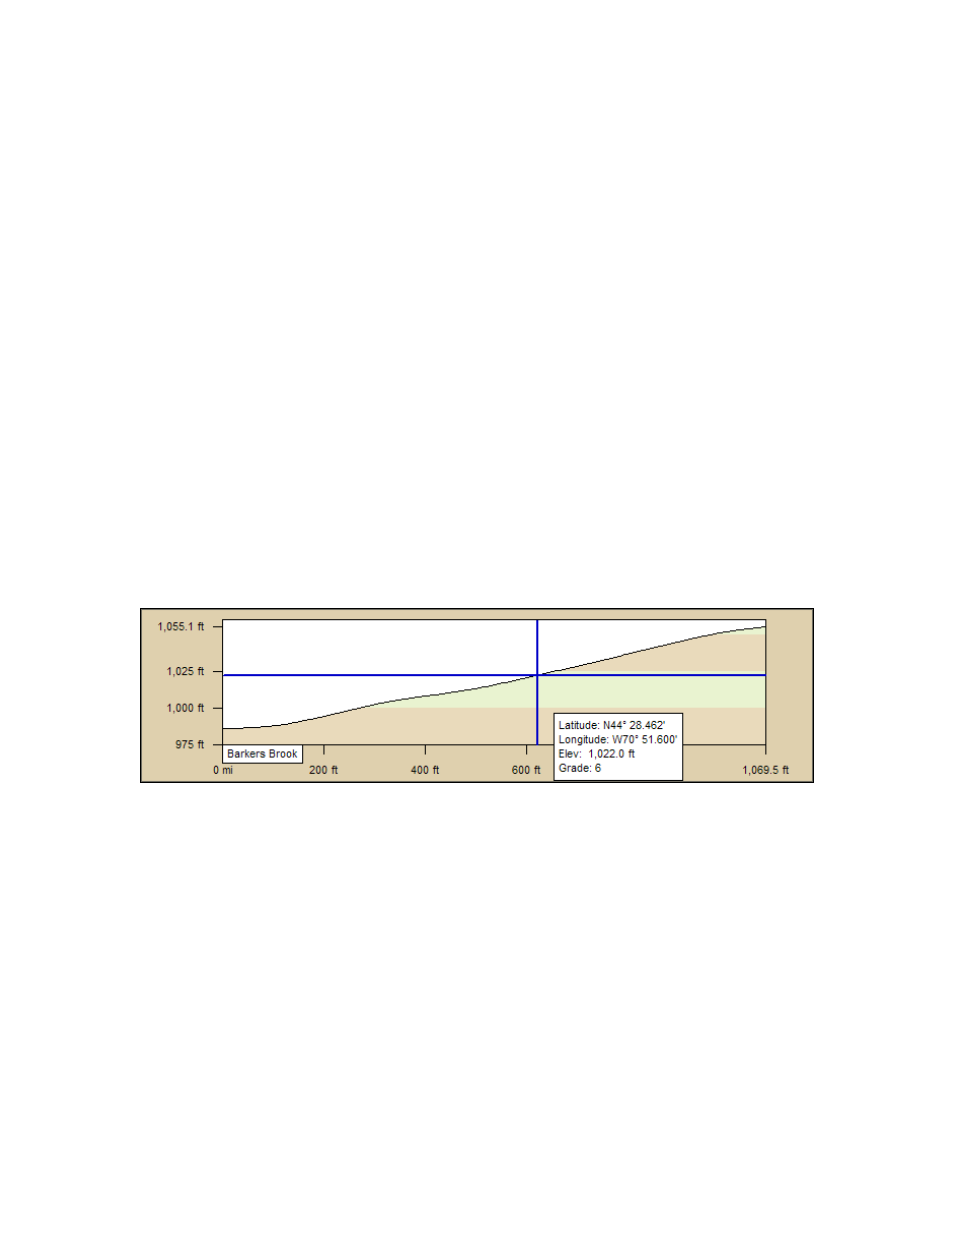
5. Move your pointer along the elevation profile in the Profile graph.
The intersection of the vertical and horizontal blue lines travels along the top
of the terrain profile. These lines indicate the elevation and distance of the
particular location. A small crosshair follows along the corresponding object
on the map. An Info box displays the profile statistics and user data (see
Statistical Data and User Profile Data for more information).
To Profile Multiple Linear Objects
• To profile multiple linear objects, press the SHIFT key on the keyboard while
clicking the items you want to profile. Thin vertical dashed lines display in the
Profile graph indicating the beginning and end of each chosen segment.
• To make it easier to profile multiple linear objects, use the Draw tab to join
them.
• To clear one of the multiple objects you have profiled, press the CTRL key on
your keyboard while clicking the profiled object on the map.
Viewing the Profile Elevation Graphs
The Profile tab lets you view two profile elevation graphs; the profile graph and the
overview profile graph.
To View the Profile Graph
The profile graph automatically displays when you select an object to profile. It
shows a two-dimensional image of the elevation associated with the selected object.
Distance and elevation are indicated below and to the left of the graph respectively.
Use the following steps to view a profile graph.
1. Create a profile of an object or route. For more information see Creating a
Profile.
2. Move your cursor along the elevation profile in the profile graph.
• The intersection of the vertical and horizontal blue lines travels along
the top of the terrain profile. These lines indicate the height and
distance of the particular location as you move along the graph.
• As you move your cursor along the graph, an info box provides
statistical data about the profile, such as coordinates, elevation, grade,
and so on. See Statistical Data for more information about this data. If
you downloaded an object with supported profile data, the info box
may also include additional data (for example, speed). See User Profile
Data for more information.