Distinguishing data points from transitions – EXFO PSO-200 Optical Modulation Analyzer User Manual
Page 70
Viewing and Analyzing Results
62
PSO-200
Distinguishing Data Points from Transitions
Distinguishing Data Points from Transitions
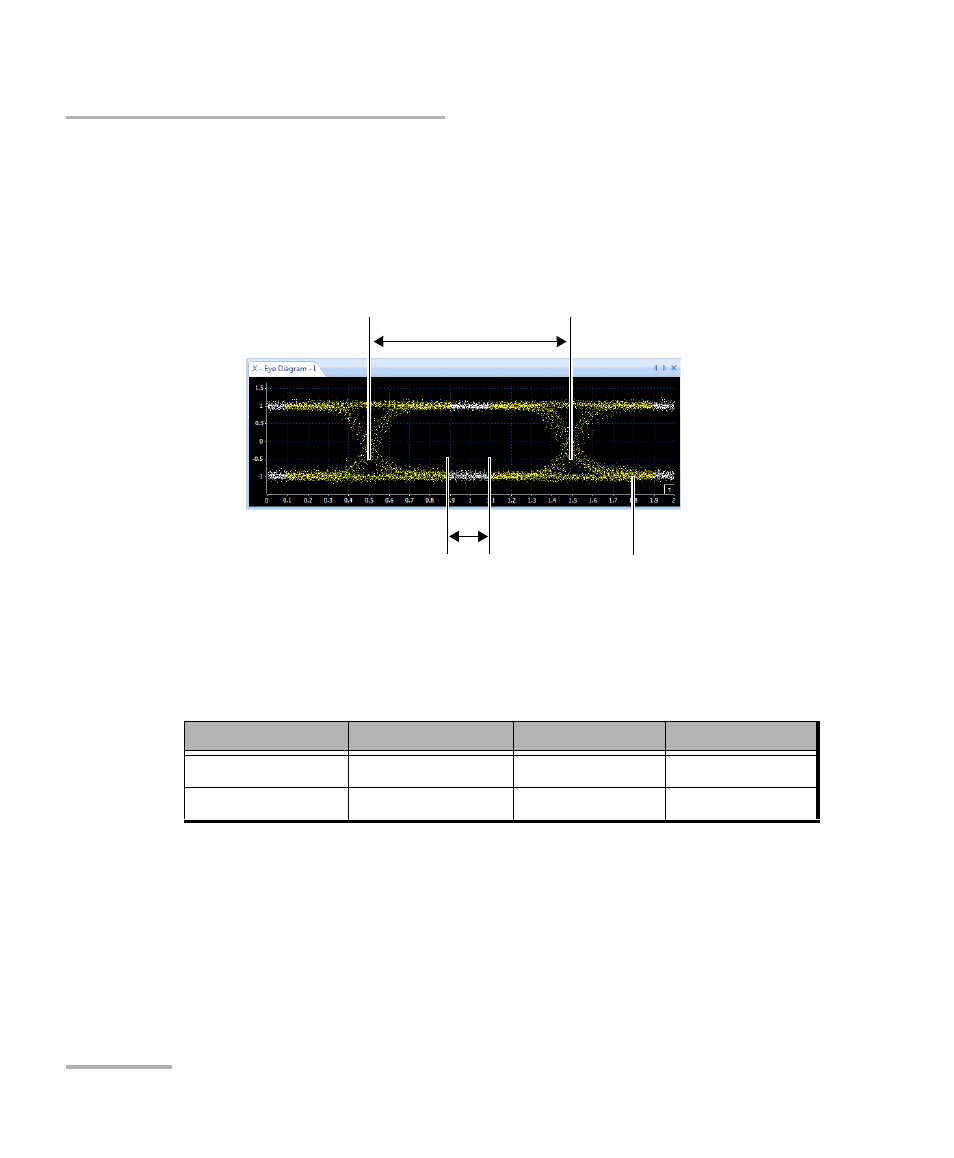
You can display “real data points” in white on all graphs simultaneously to
distinguish them from other points, called “transitions”. It allows you to
rapidly see if data points are where they should be (a point in the transition
path would be considered as an error).
Data points are determined using a measurement window, which is a time
range that you define as a percentage of the symbol period, as shown
above. The following default values are set according to standards:
With data points highlighted in white, the application allows you to hide (or
show) transition points, on the constellation chart only.
Note: You cannot modify the display of data points and transitions when graphs
are shown in Color Grade mode or when averaging is set (see Using
Averaging to Improve Results on page 70).
Available Range
NRZ Default
RZ Default
Lower bound
0 – 100 %
40 %
47.5 %
Upper bound
0 – 100 %
60 %
52.5 %
Data measurement window
(lower and upper bounds)
Symbol period
Transitions
40 %
60 %
Sample QPSK (NRZ)