I/q eye diagrams, Phase eye diagram – EXFO PSO-200 Optical Modulation Analyzer User Manual
Page 52
Customizing the Graph and Data Layout
44
PSO-200
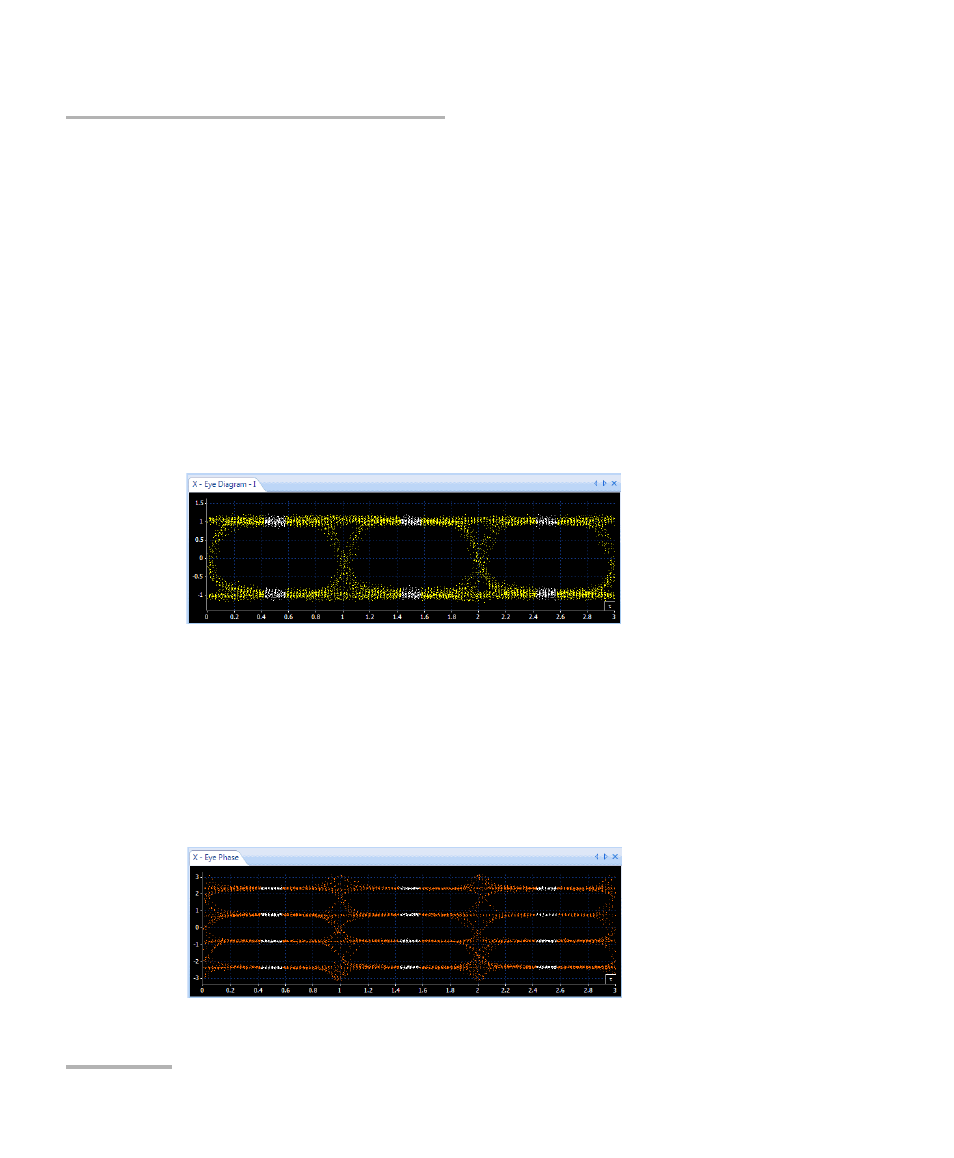
Eye Diagrams
I/Q Eye Diagrams
The I (in-phase) and Q (quadrature) eye diagrams represent the “real” and
“imaginary” parts of the complex field as a function of time, respectively.
where t
B
is the remainder after division with the symbol period .
The I eye diagram can be seen as the data visible by looking from the right
of the constellation chart. Similarly with the Q eye diagram by looking from
the top.
Phase Eye Diagram
Eye diagram of arg(E(t
B
)). No amplitude information is provided.
This graph shows the different phases of the signal and the transitions. Its
use is to see the phase shifts in PSK and QAM modulations.
The example below shows four phase levels: /4, 3 /4, -/4, -3/4.
I t
B
( )
Re
E t
B
( )
(
)
=
Q t
B
( )
Im
E t
B
( )
(
)
=
NRZ-QPSK data
QPSK data
- ADSL2+ (124 pages)
- ADSL2+ (267 pages)
- ADSL2+ (275 pages)
- ARU-100 HPNA Test Probe (26 pages)
- ARU-100 HPNA Test Software Option for DSL/IP Tests (3 pages)
- AXS-100 Series OTDR (155 pages)
- AXS-200 SharpTESTER (70 pages)
- AXS-200/610 Copper Test Module (152 pages)
- AXS-200/650 IP Triple-Play Test Set (91 pages)
- AXS-200/850 Ethernet Test Set (262 pages)
- CableSHARK P3 VF/DSL Cable Qualifier (321 pages)
- DC0091A (3 pages)
- ELS-500 Light Source (45 pages)
- EOT Series (2 pages)
- EPM-ELS-50 (206 pages)
- ETS-1000 (173 pages)
- ETS-1000G (195 pages)
- ETS-1000L (47 pages)
- EXpert IP Test Tools (62 pages)
- EXpert IPTV Test Tools (FTB-1 / 2 Pro) (82 pages)
- EXpert IPTV Test Tools (FTB-200v2) (82 pages)
- EXpert VoIP Test Tools (107 pages)
- FIP-400 Fiber Inspection Probe and ConnectorMax (78 pages)
- FIP-400B Fiber Inspection Probe Multifiber (2 pages)
- FIP-400B Fiber Inspection Probe and ConnectorMax2 (111 pages)
- FIP-425B/435B Fiber Inspection Probe and ConnectorMax2 Mobile (103 pages)
- FLS-110 Optical Polarized Source (18 pages)
- FLS-300 Light Source (40 pages)
- FLS-5800 CD/PMD Analyzer Source (106 pages)
- FLS-5800 CD/PMD Analyzer Source (98 pages)
- FLS-5800 (6 pages)
- FLS-600 Light Source (79 pages)
- FOA Compatibility (3 pages)
- FOT-5200 Coarse Spectrum Analyzer (47 pages)
- FOT-930 Multifunction Loss Tester (111 pages)
- FTB -5240S/5240BP Optical Spectrum Analyzer for FTB 500 (NS-1434) (537 pages)
- FTB-5230S Optical Spectrum Analyzer for FTB 200 v2 (659 pages)
- FTB-5230S Optical Spectrum Analyzer for FTB 200 v2 (251 pages)
- FTB -5240S/5240BP Optical Spectrum Analyzer (638 pages)
- FTB-1 (234 pages)
- FTB-2 Pro (6 pages)
- FTB-2 Pro (443 pages)
- FTB-200 v2 Compact Modular Platform (222 pages)
- FTB-2200 for FTB-200 v2 (41 pages)
- FTB-3930 MultiTest (101 pages)