Eye diagrams – EXFO PSO-200 Optical Modulation Analyzer User Manual
Page 51
Customizing the Graph and Data Layout
Optical Modulation Analyzer
43
Eye Diagrams
Eye Diagrams
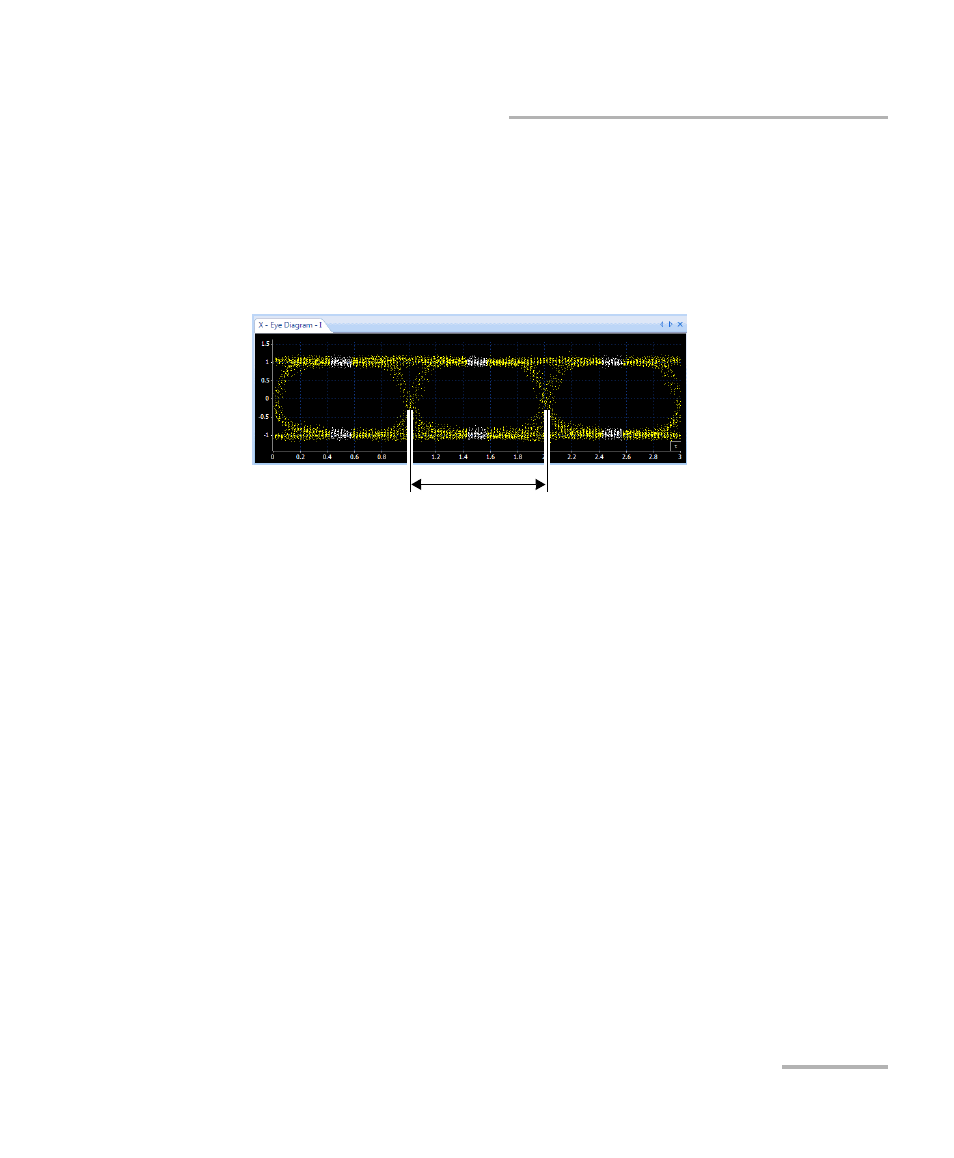
An eye diagram is a trace of the intensity, magnitude, or phase, as a
function of time, where the corresponding time vector has been “folded”
to an integer number of symbol periods (see Equivalent-Time Sampling on
page 241).
Traditionally, intensity (power) has been shown in eye diagrams, since the
power itself contains the information in on-off keying (OOK) data
modulation. With more complex phase-encoded signals with coherent
detection, I/Q amplitude and phase are also shown in eye diagrams.
To acquire the eye diagram, the PSO-200 relies on a time reconstruction
algorithm that works like a software-based clock recovery.
Note: All eye diagrams are normalized on the Y-axis.
Several system performance measures can be derived by analyzing the eye
diagram. It allows you to determine whether the signal exhibits excessive
jitter or noise, or if it is too slow to change, or displays unacceptable
overshoot. Distortion of the signal waveform due to inter-symbol
interference (ISI) and noise appears as closure of the eye diagram.
For details about the measurements derived from the eye diagrams, see
Measurements for Eye Diagrams on page 258.
Symbol period