Using zoom controls, Using – EXFO FTB -5240S/5240BP Optical Spectrum Analyzer for FTB 500 (NS-1434) User Manual
Page 404
Managing Results
396
FTB-5240S/5240BP
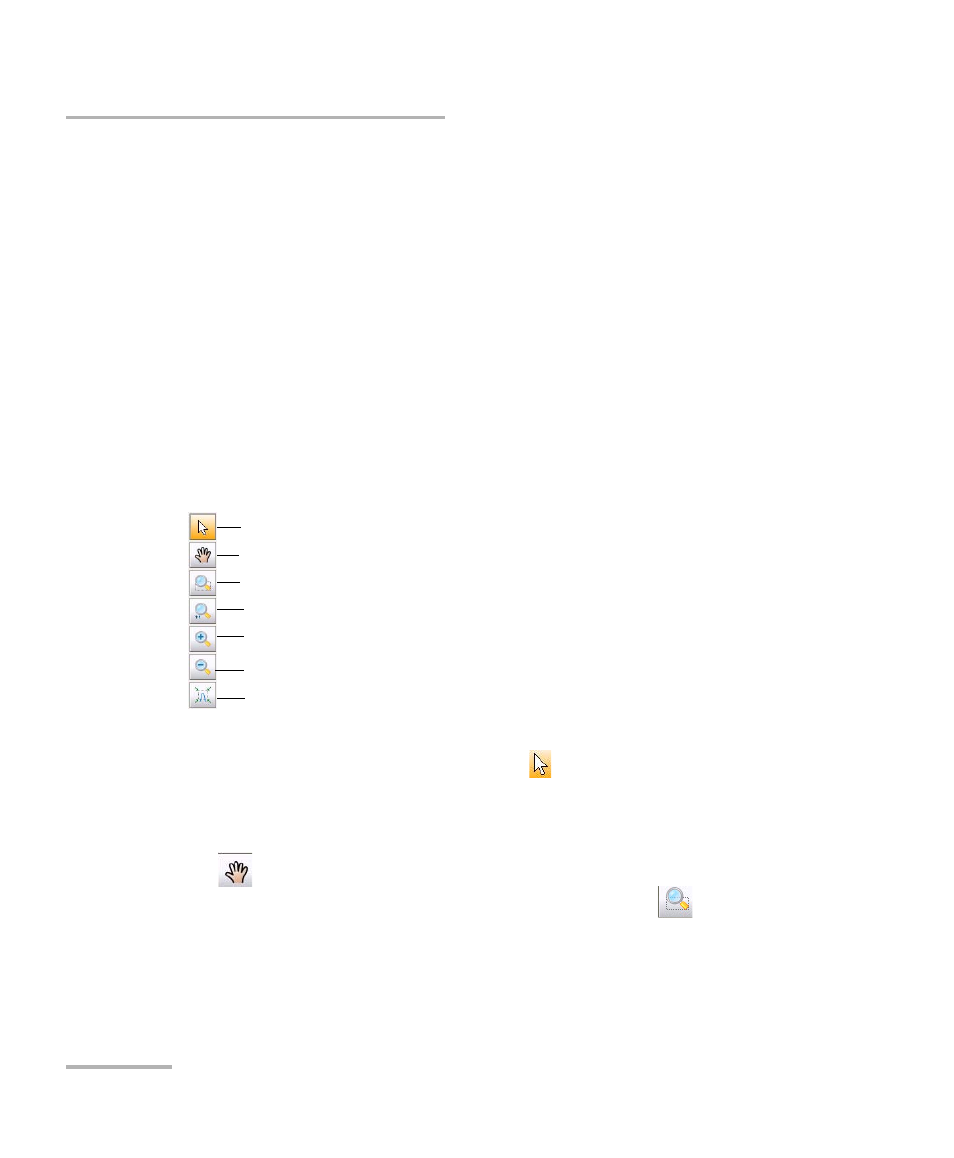
Using Zoom Controls
Using Zoom Controls
Use the zoom controls to change the scale of the trace display.
You can zoom in on or out of the graph using the corresponding buttons or
let the application automatically adjust the zoom on the currently selected
peak from the results table.
You can quickly zoom in on or out of a selected peak.
You can also return to the original graph value.
The application provides an automatic zoom on peak feature. When this
feature is activated and you press on a row in the peak results grid, the
graph will zoom and tab to show that peak covering 75 % of the graph
canvas. By default, this option is deactivated.
Note: You can only move the markers with the button.
To view specific portions of the graph:
³
You can define which portion of the graph will be visible by pressing
and dragging the graph with the stylus or your finger.
³
You can also zoom in on a specific area by pressing
and defining
the zoom area with the stylus or your finger (a rectangle with dotted
lines will appear to help you define the area). Once you release the
stylus, the application automatically zooms in on the graph.
Selection mode
Move view area
Zoom in on the defined area
Zoom in
Full view
Zoom out
Auto zoom on peak